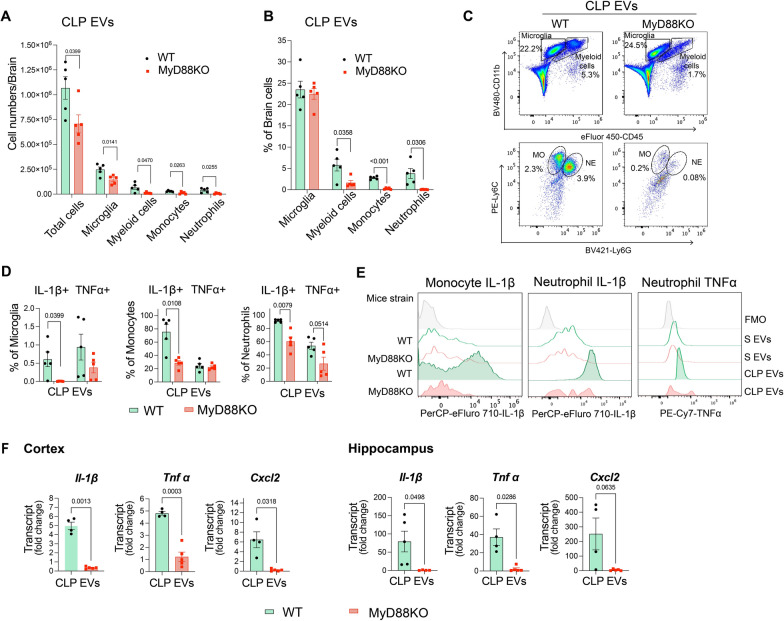
Fig. 8.
MyD88 contributes to brain inflammation driven by plasma sepsis EVs. CLP plasma EVs (8 × 10⁸ EV particles/brain) were delivered via ICV to both WT and MyD88 KO mice. Cell population in the brain was analyzed at 16–22 h using flow cytometry. A, B Cell number and percentage of each population. n = 5/group. C. Representative figure of flow cytometry. MO monocyte, NE neutrophil. D Percentage of microglia, monocytes and neutrophils expressing intracellular IL-1β or TNFα. n = 5/group. E Representative histogram of flow cytometry. S-EVs sham plasma EVs, CLP EVs sepsis plasma EVs. FMO fluorescence minus one. F Cytokine gene expression in brain tissues measured by qRT-PCR. n = 4–5/group

