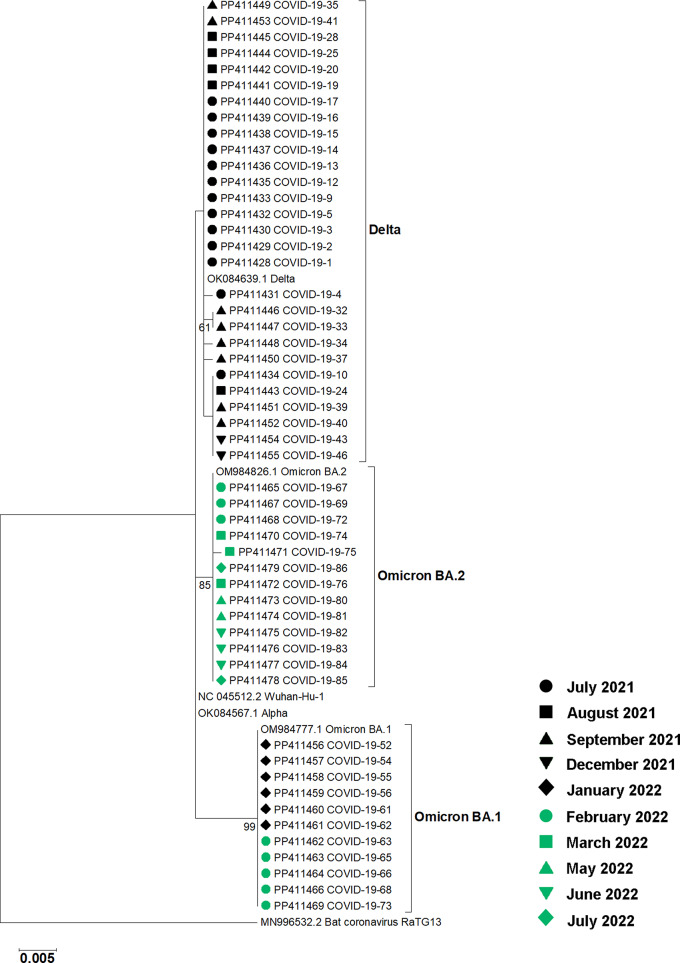
Fig. 2.
Phylogenetic analysis of SARS-CoV-2 partial S gene sequences from 52 nasal swab samples collected at Hospital A. The tree was constructed using the maximum likelihood method with a bootstrap value of 1,000. Accession numbers for sequences obtained in this study and reference sequences are shown. Labels indicating the months of sample collection are shown. Bootstrap values greater than 50 are indicated at the nodes. The bar represents nucleotide substitutions per site. A bat coronavirus sequence was used as an outgroup

