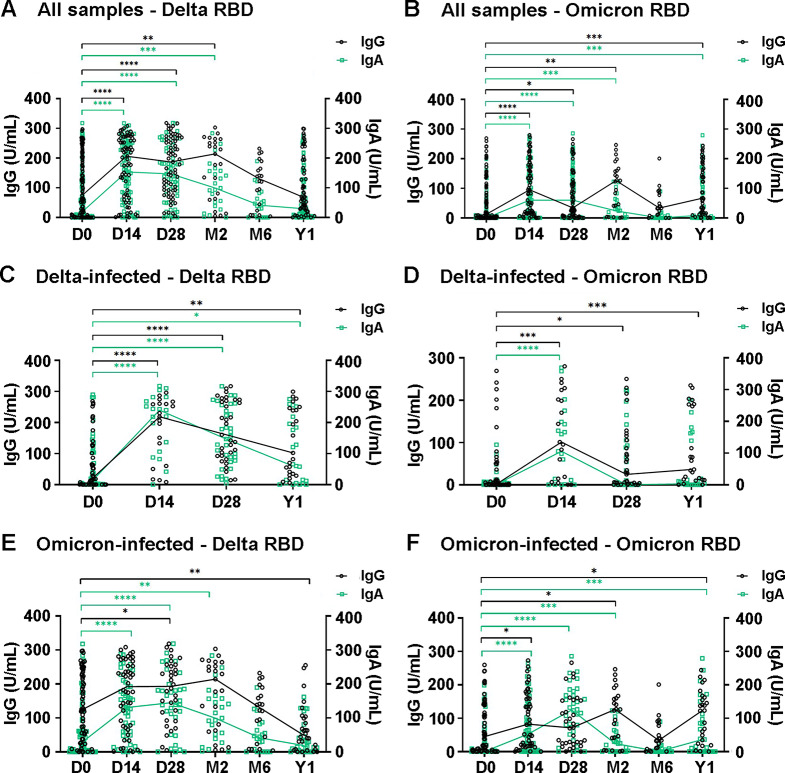
Fig. 5.
Levels of RBD-specific IgG and IgA antibodies in plasma over a one-year follow-up period. IgG levels are represented on the left y-axis, and IgA levels on the right y-axis. (A) and (B) show antibody levels to the RBD of Delta and Omicron variants, respectively, in all samples. (C) and (D) show antibody levels in Delta-infected samples from Hospital A. (E) and (F) show antibody levels in Omicron-infected samples from Hospitals A, B, and C. The Mann-Whitney U test was used to compare the medians of non-normally distributed data. *, p ≤ 0.05; **, p ≤ 0.01; ***, p ≤ 0.001; and ****, p ≤ 0.0001 indicate statistical significance

