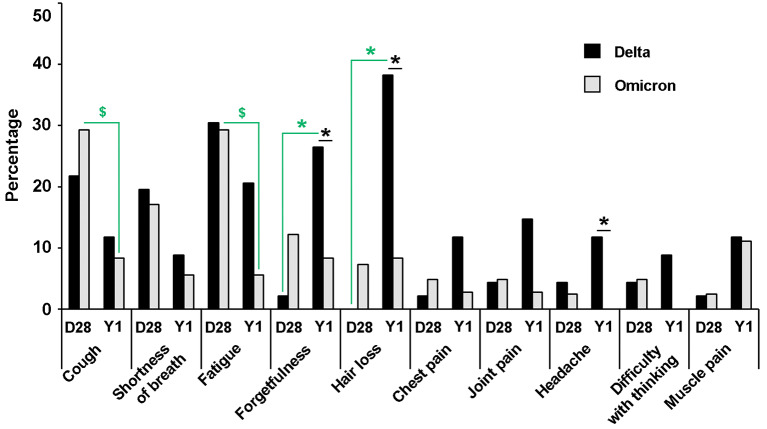
Fig. 6.
Post-COVID-19 sequelae reported at day 28 and one year after infection. The percentage of participants reporting different sequelae is shown for groups infected with the Delta variant (black bars) and the Omicron variant (grey bars). Pearson’s chi-square test was used to compare the number of participants reporting post-COVID-19 sequelae between groups infected with different variants and at different time points post-infection. Stars and dollar signs indicate statistical significance at p ≤ 0.05. Green stars represent significant differences in Delta-infected participants between day 28 and year 1. Green dollar signs represent significant differences in Omicron-infected participants between day 28 and year 1. Black stars represent significant differences between Delta and Omicron infections

