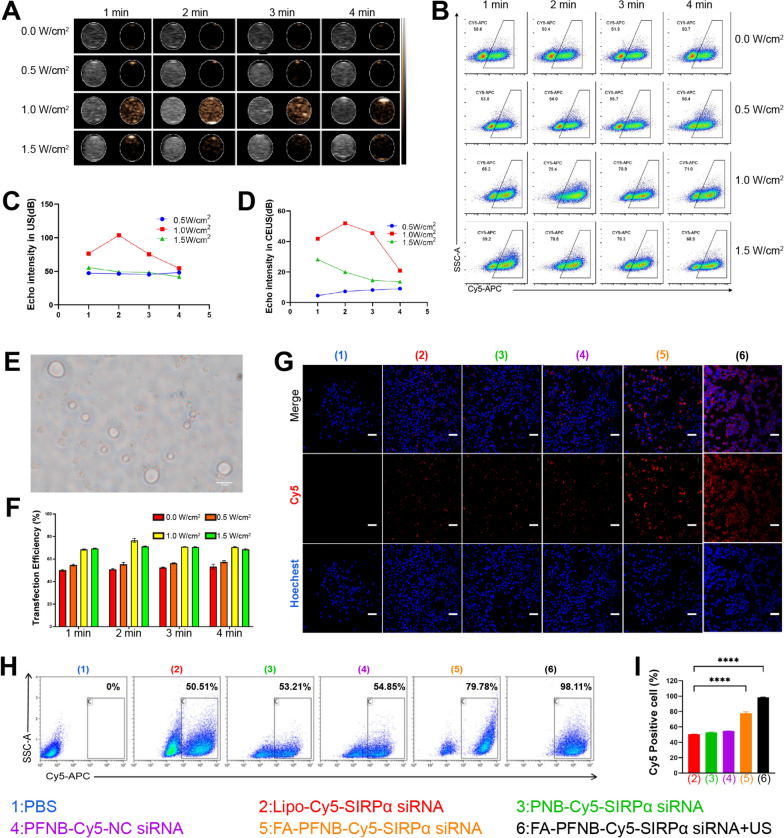
Fig. 2.
In vitro ultrasound imaging and transfection efficiency of different conditions. A Ultrasound imaging (left: B-Mode, right: contrast-enhanced ultrasound) of PNB-SIRPα siRNA. B, F Transfection efficiency for different ultrasound parameters. C, D Quantitative analysis of PNB-SIRPα siRNA echo intensity following LIFU irradiation at various intensities and durations in B-mode (C) and CEUS mode (D). E Phase change microscopy image of PNB-SIRPα siRNA (scale bar = 10 µm). G Laser confocal microscope images of the M2-like macrophage uptake of different nanocarriers (scale bar = 100 µm). H, I The transfection efficiency of different nanocarriers by flow cytometry. Data was presented by the mean ± SD (n = 3) per group. *P < 0.05; **P < 0.01; ***P < 0.001; ****P < 0.0001

