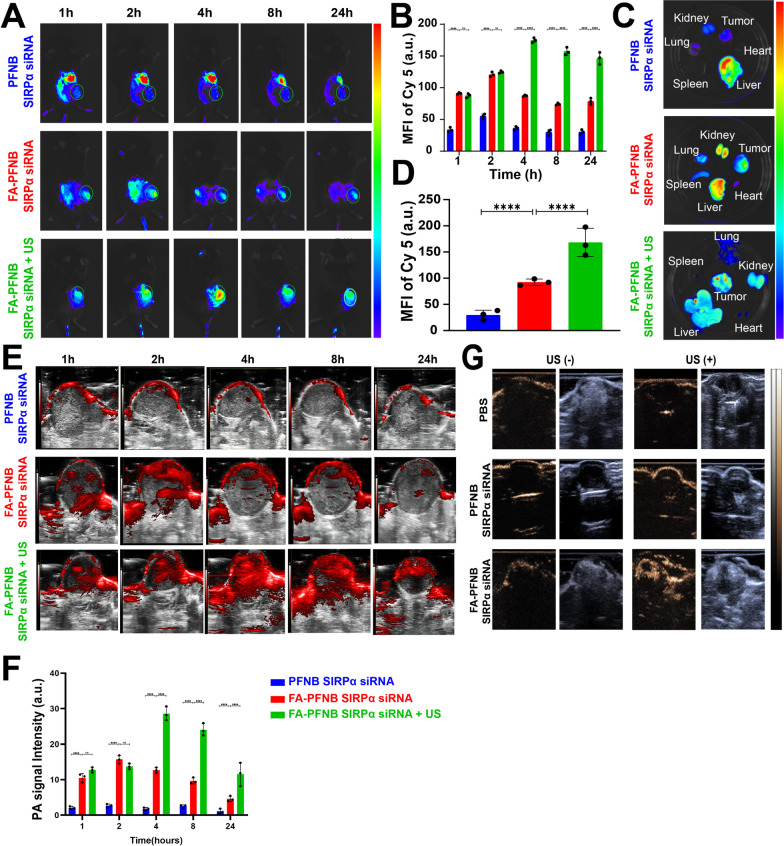
Fig. 5.
In vivo multimodal imaging images. A, B Biodistribution of FA-PFNB-Cy5-SIRPα siRNA in LLC tumor-bearing C57BL/6 mice (Number of replicates, n = 3). C, D The organs and tumor tissues were imaged at the peak of fluorescence value in vivo (Number of replicates, n = 3). E, F PA images of the tumors in model rats of PFNB-SIRPα siRNA or FA-PFNB-SIRPα siRNA and FA-PFNB-SIRPα siRNA + US groups (Number of replicates, n = 3). G Ultrasound imaging of mice bearing non-small cell lung cancer tumors with different treatment groups in B-mode and CEUS mode before and after Low-intensity focused ultrasound (Number of replicates, n = 3). Data was presented by the mean ± SD (n = 3) per group. *P < 0.05; **P < 0.01; ***P < 0.001; ****P < 0.0001. PA, photoacoustic imaging; MFI, mean fluorescence intensity; LIFU, low-intensity focused ultrasound; SIRPα, signal regulatory protein α

