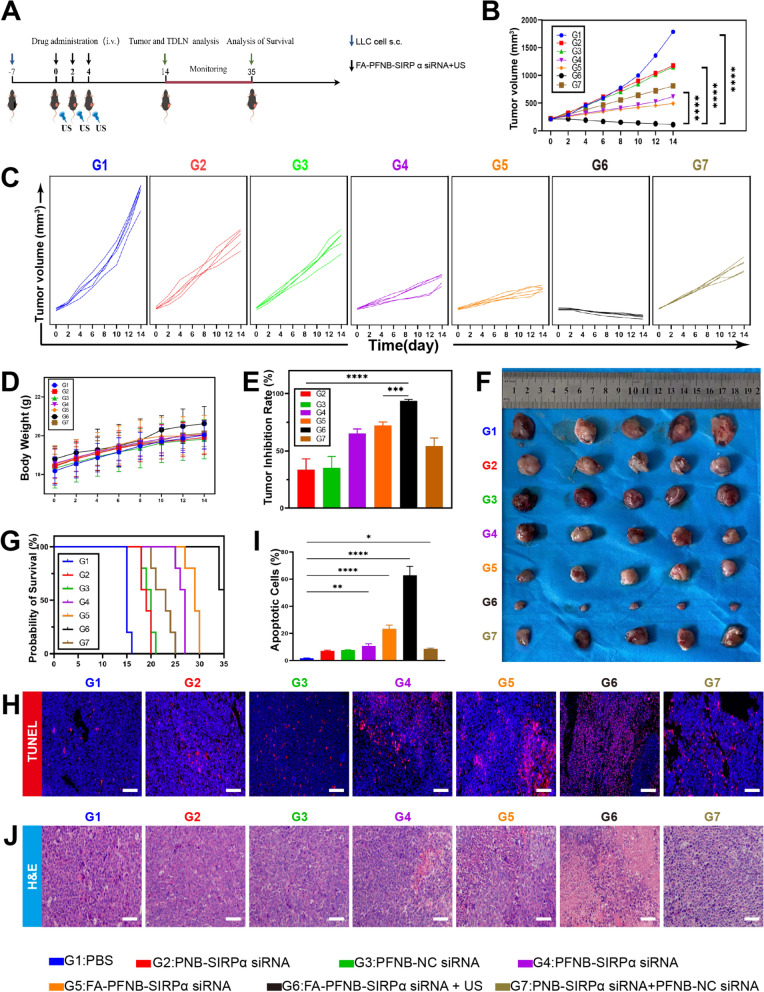
Fig. 6.
Antitumor activity of FA-PFNB-SIRPα siRNA + ultrasound (US) in the NSCLC model. A Illustration of the in vivo experimental design. B NSCLC tumor growth curves in different groups (n = 5). C Spaghetti plots of NSCLC tumor growth in different groups (n = 5). D The body weight of mice in different groups(n = 5). E Tumor inhibition ratio in different groups(n = 5). F Image of representative NSCLC tumors in different groups. G Survival rate in different groups (n = 5). H and I TUNEL analysis of NSCLC tumors in different groups (Scale bar: 10μm). J H&E staining analysis of NSCLC tumors in different groups (Scale bar: 10μm). Data was presented by the mean ± SD. *P < 0.05; **P < 0.01; ***P < 0.001; ****P < 0.0001

