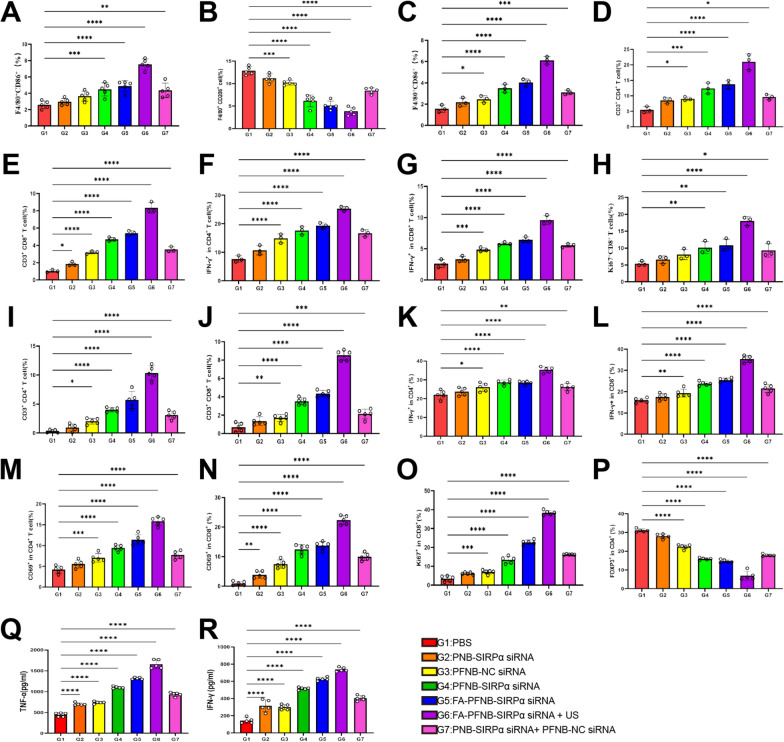
Fig. 7.
Anticancer immune response in the tumor and TDLNs. A, B M1-like macrophages (F4/80+ CD86+), M2-like macrophages (F4/80+CD206+) in tumor tissue(n = 5). C M1-like macrophages (F4/80+ CD86+) in TDLN (n = 3). D, E CD3+CD4+ and CD3+CD8+ T cells in TDLN (n = 3). F, G Activated CD4 +and CD8+ lymphocytes in TDLN (CD4+IFNγ+, CD8+IFNγ+) (n = 3). H Percentages of proliferation in CD8 lymphocytes in TDLN (CD8+ki67+) (n = 3). I, J CD3+CD4+and CD3+CD8+ T cells in tumor tissue(n = 5). K–N Activated CD4 and CD8 lymphocytes in tumors tissue (CD4+IFNγ+, CD4+CD69+.CD8+IFNγ+, CD8+CD69+) (n = 5). O Percentages of proliferation in CD8 lymphocytes in tumor tissue (CD8+ki67+) (n = 5). P Percentages of Tregs (CD4+FOXP3+) in tumor tissue (n = 5). Q, R ELISA analysis of IFN-γ and TNF-α in tumor tissue(n = 5). Data was presented by the mean ± SD. *P < 0.05; **P < 0.01; ***P < 0.001; ****P < 0.0001

