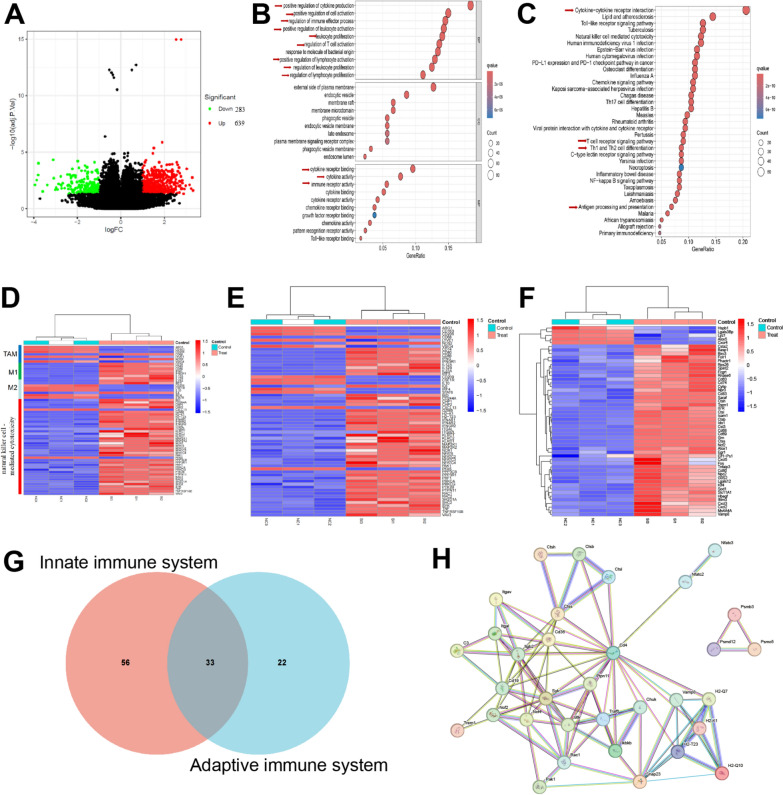
Fig. 8.
Transcriptomic analysis. A A volcano plot of the FA-PFNB-SIRP α siRNA + US and PBS group. B, C Gene ontology annotation analysis (B) and Kyoto Encyclopedia of Genes and Genomes pathway analysis (C) in the FA-PFNB-SIRP α siRNA + US group. D Heat map illustrating differential gene expression of macrophages (M1 and M2) and natural killer cell-mediated cytotoxicity. E, F Heat map depicting differential expression of antigen processing and presentation-related genes (E) and T cell functional markers (F). G Venn diagram illustrating differentially expressed genes positively regulating both innate and adaptive immune responses. H Functional networks of differentially expressed immune-related genes regulating both innate and adaptive immune responses

