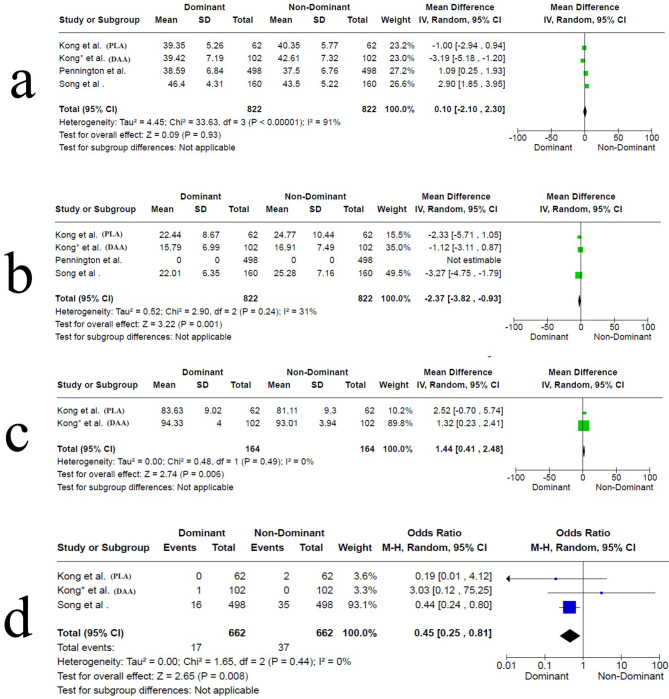
Fig. 2.
Forest plot showing the pooled results of the included studies. a, acetabular cup inclination. b, acetabular cup anteversion. c, functional outcome according to Harris Hip Score. d, dislocation rate. (Forest plot a, shows high heterogeneity (I² = 91%), indicating substantial variability among the studies. Forest plot b, demonstrates moderate heterogeneity (I² = 31%), suggesting that the observed differences are partially due to true heterogeneity. In both, a random-effects model accounted for the variability and provided a more conservative estimate of the overall effect. Forest plots c and d, show no heterogeneity (I² = 0%), implying minimal variability among the studies. In such cases, a fixed-effects model could be justified; however, a random-effects model was still applied to provide a more generalized result, consistency across analyses, and account for potential unobserved heterogeneity)

