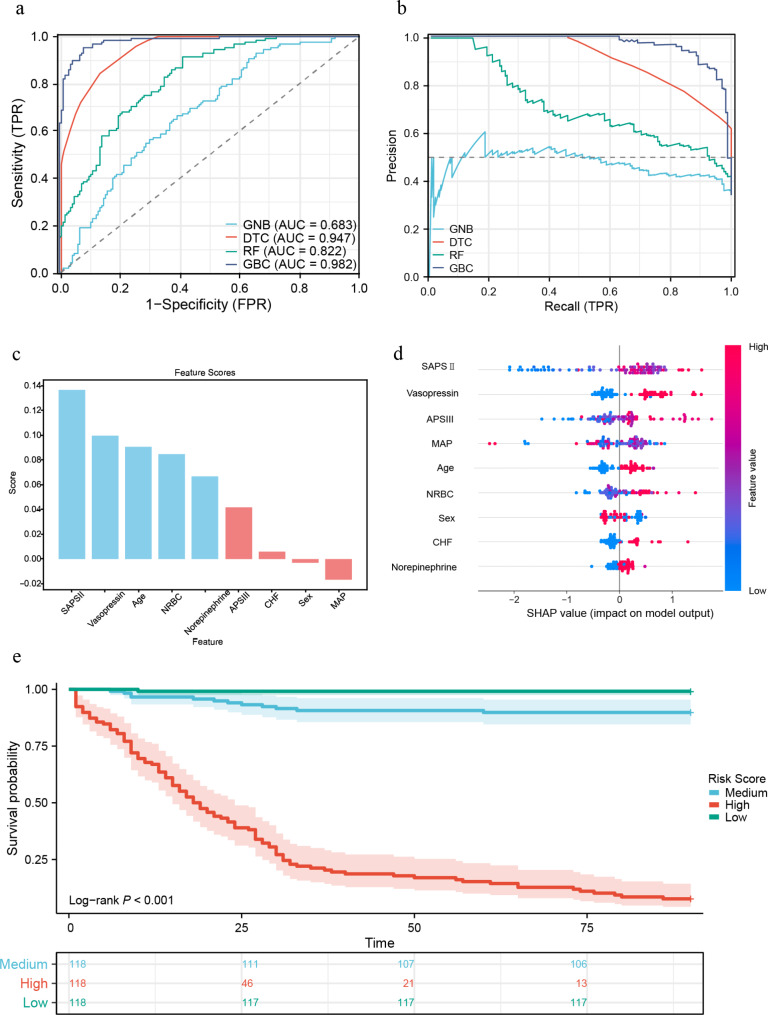
Fig. 4.
The NRBC-based risk score efficiently predicts 90-day Mortality (a) ROC curves for the performance of various machine learning models in predicting 90-day mortality are as follows: GBC model AUC (95% CI) = 0.982 (0.970–0.994); DTC model AUC (95% CI) = 0.947 (0.928–0.967); RF model AUC (95% CI) = 0.822 (0.779–0.865); GNB model AUC (95% CI) = 0.683 (0.627–0.739); (b) Precision-Recall curves for various machine learning models illustrate performance metrics, with a greater curve towards the upper right corner indicating superior model performance.; (c) Ranking of feature variable importance in the GBC models; (d) SHapley Additive Explanation visualization illustrating the individual feature impacts on the outcomes of the GBC prediction model. The color spectrum represents the degree of influence, where redder hues indicate a higher association with the risk of 90-day Mortality, while bluer hues suggest a lower association with the risk of 90-day Mortality; (e) Survival curve analysis in subgroups with different risk scores. NOTE: The three subgroups for the survival curve analyses were established based on the tertiles derived from the mortality probability generated by the GBC prognostic model constructed using the 9 variables

