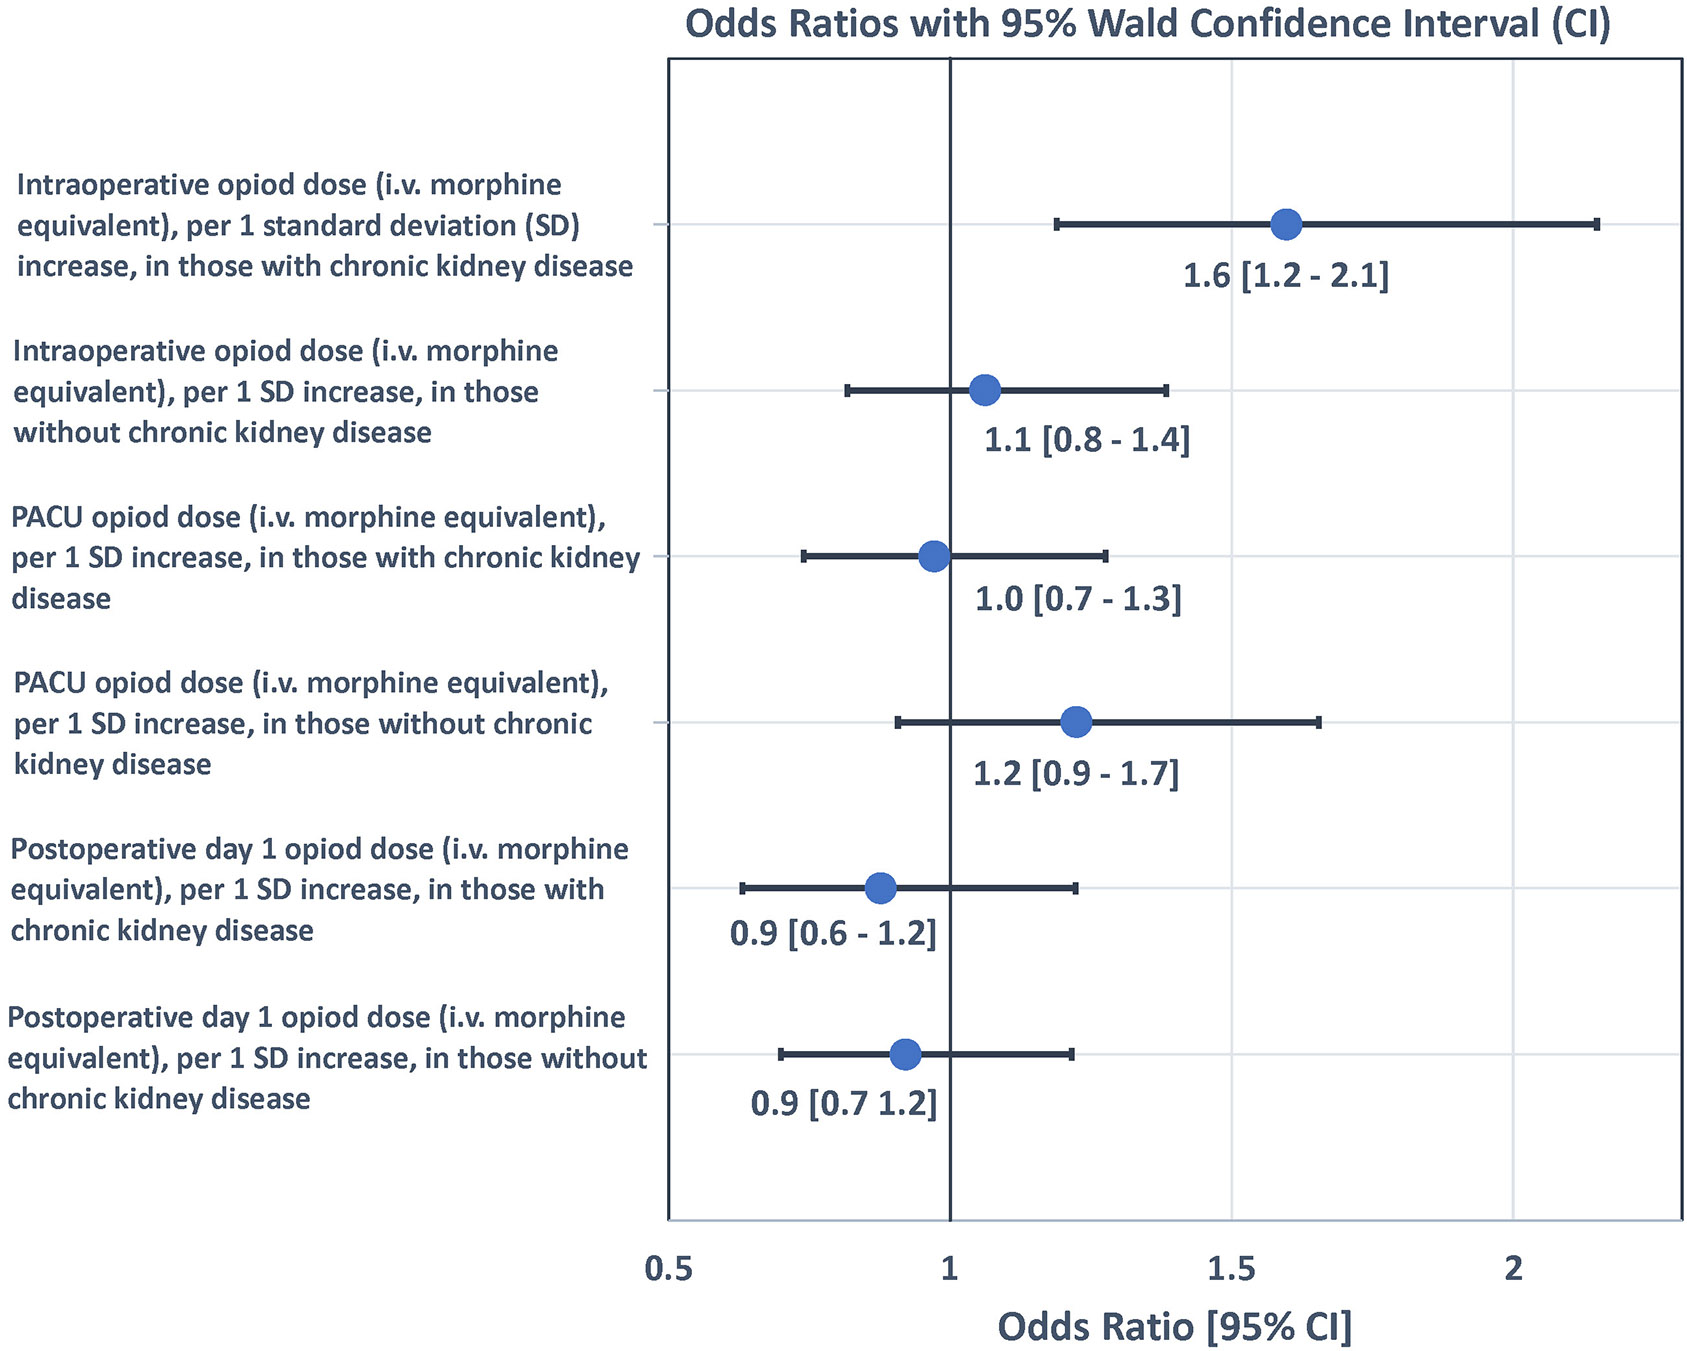
Figure 1:

Forrest plot of odds ratios for opioid dose for prediction of delirium on postoperative day 2 by presence or absence of chronic kidney disease. OR = Odds Ratio. Odds Ratio adjusted for age, ASA, dementia status, and change in creatinine from ED to POD1. SD=standard deviation. PACU=post anesthesia care unit. POD=postoperative day.
