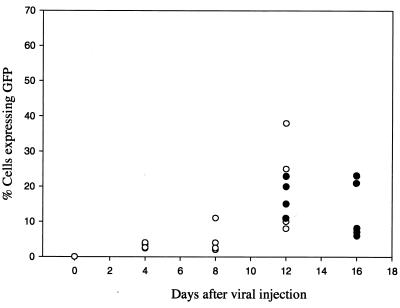
FIG. 8.
In vivo tumor GFP expression after infection with YLD virus. Nude mice with established A2780 human ovarian peritoneal carcinomatosis were infected with YLD virus at 108 PFU, injected intraperitoneally. Tumor was sampled every 4 days, and FACS analysis was performed for GFP expression. The graph represents the percentage of cells expressing GFP on the various days after virus delivery. Two experiments were performed. One experiment was performed with a 4-week tumor burden (5- to 7-mm tumor nodules), shown as open circles. The second experiment was performed with 2-week tumors (1- to 2-mm nodules), shown as filled circles. Each circle represents a single animal. There are at least four animals per group. On some days the circles overlap.

