. 2024 Oct 2;20(9):595–610. doi: 10.1039/d4mo00163j

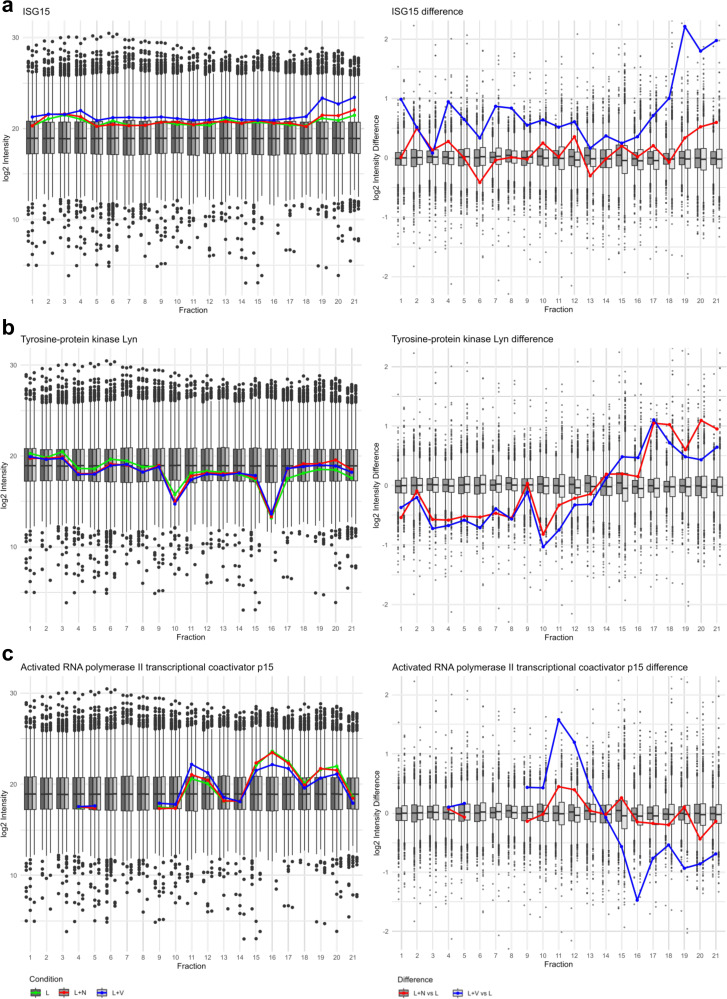
Fig. 8. Protein complex dynamics according to log2 intensity distribution and differences across SEC fractions. (left) Log2 intensity distribution of ISG15 (a), tyrosine-protein kinase Lyn (b) and Activated RNA polymerase II trasncribtional coactivator p15 (Sub1) (c) depicted as line graph for the conditions LPS (L, green), nigericin (L + N, red) and VbP (L + V, blue) in front of boxplot background illustrating the range of abundances for all detected proteins for the conditions LPS (L, dark grey), nigericin (L + N, grey) and VbP (L + V, light grey). (right) Log2 intensity differences of all detected proteins were calculated by subtracting the log2 intensity values of the LPS condition from those of the nigericin and VbP conditions, per protein and per fraction, respectively. Log2 intensity difference of ISG15 (a), tyrosine-protein kinase Lyn (b) and Sub1 (c) depicted as a line graph for the calculation of nigericin – LPS (L + N vs. L, red) and VbP – LPS (L + V vs. L, blue) in front of the box plot depiction of the difference range all detected proteins.

Fig. 8