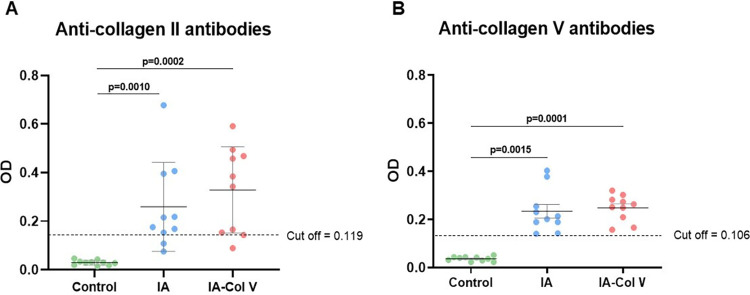
Fig 5. Anti-collagen antibody frequency in the sera of the control, IA and IA-Col V groups.
Panels A and B show a graphical representation of types II (A) and V (B) anti-collagen antibody frequencies in the sera of animals from the control, IA and IA-Col V groups. We considered positivity to anti-Col II and V to optical density (OD) values above the cutoff (the cutoff line indicates OD values = 3 SD above the mean OD of 13 control serum samples obtained from Lewis rats before induced arthritis (on day zero)). SD: standard deviation. GraphPad Prism 8.0 software was used for the Kruskal‒Wallis test with Dunn post hoc test.

