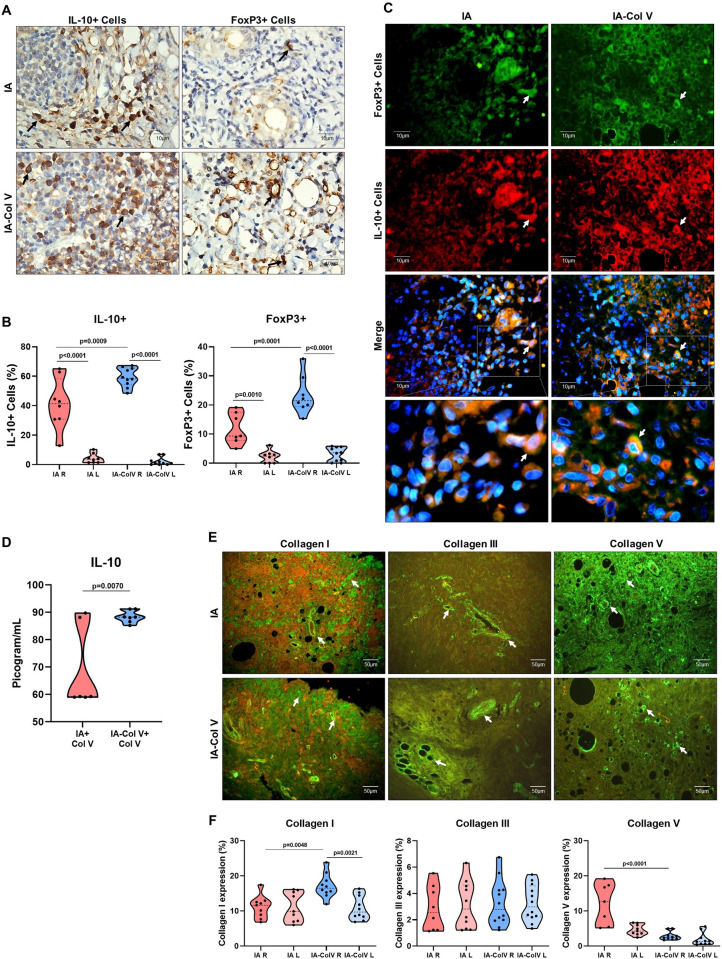
Fig 6. Immunohistochemistry and immunofluorescence of synovial tissue from the IA and IA-Col V groups.
Panel A: IL-10 and FoxP3 expression in the subsynovial and perivascular regions (arrows). Panel B: Graphical representation of the amounts of IL-10 expressed in the synovial tissue. Panel C: Colocalization of immunofluorescence in the synovial tissue to FoxP3 (green), IL10 (red), FoxP3/IL10 (merge) and details of the merge. The nuclei were stained blue with DAPI. Panel D: Graphical representation of the IL-10+ dose in conditioned culture medium from IA-Col V and IA groups spleen cells stimulated by Col V. Panel E: Immunofluorescence of collagen I, III and V (arrows). Panel F: Graphical representation of the amounts of Col I, III and V in the synovial tissue. GraphPad Prism 8.0 software was used for unpaired t tests.

