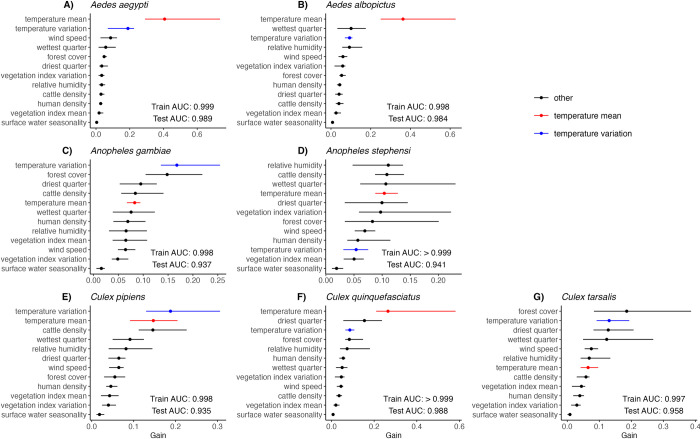
Fig 2. Temperature mean (red) and standard deviation (blue) were important predictors of mosquito occurrence for all focal species.
Variable importance, measured in gain, is shown for each predictor variable by species. Temperature mean variables, including year-round temperature annual mean, photoperiod activity season temperature mean, and precipitation activity season temperature mean, are colored in red; only the most biologically appropriate temperature mean variable was included for each species (Table 1). Likewise, temperature standard deviation variables (Table 1) are colored in blue. Other predictors (black bars) include cattle density, enhanced vegetation index mean, enhanced vegetation index standard deviation, forest cover percentage, human population density, precipitation of the driest quarter, precipitation of the wettest quarter, relative humidity, surface water seasonality, and wind speed. Points represent the median importance across the 20 bootstrapped model iterations and lines represent the range over all model iterations. Test and training AUC values are similarly medians and full ranges over the model iterations.

