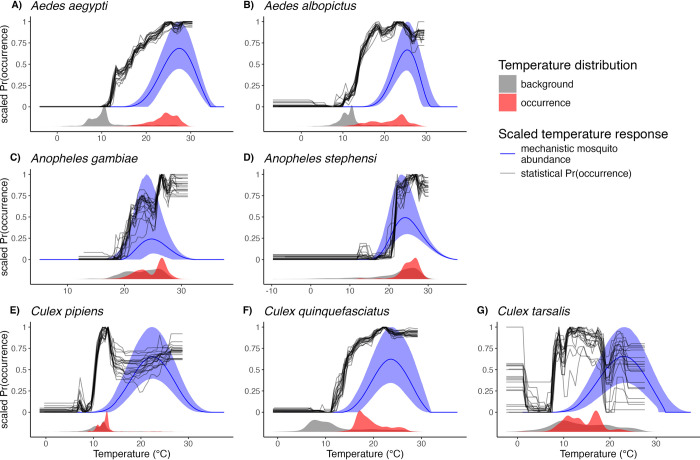
Fig 3. Comparing mosquito temperature responses from mechanistic laboratory-based mosquito abundance models and XGBoost statistical models.
Mosquito abundance for each species is estimated as the median M(T) curve with a shaded 95% credible interval band (blue lines and shaded ribbons). XGBoost covariate responses are univariate partial dependence plots (PDPs) for annual mean temperature, where mean temperature was bounded by photoperiod or precipitation for a subset of species, that show the marginal effects of temperature on model prediction (black lines). Each black line for the PDPs represents one of the 20 model iterations. Both M(T) and PDPSs are scaled to range from 0 to 1. Grey and red density plots in the bottom of each panel show the distribution of observed annual temperatures for background and occurrence points, respectively.

