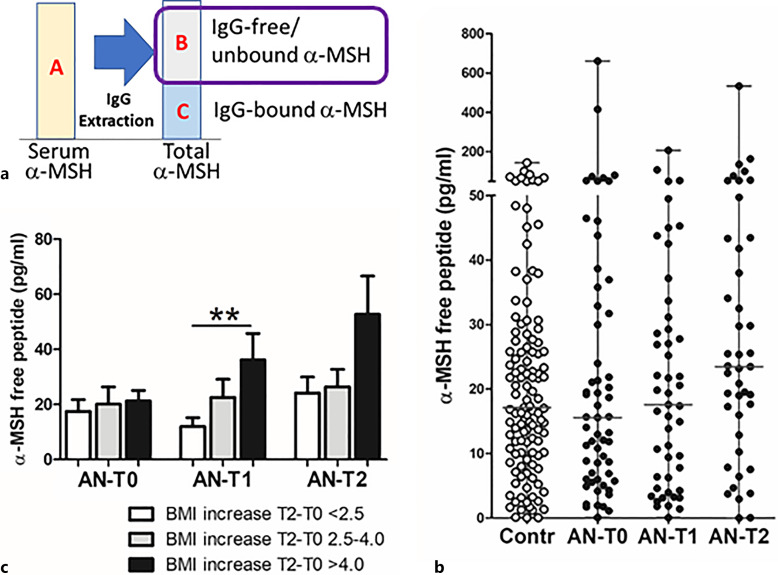
Fig. 3.
Concentration of IgG-free α-MSH. a Schematic illustration of α-MSH assay with the surrounded part presented in the figure. b Individual levels (with median) of IgG-free α-MSH in healthy subjects (Contr) and patients with AN at 3 time points: T0: hospital admission, T1: at discharge, and T2: at 1-year follow-up visit. c α-MSH levels according to BMI-SDS increase in T2 from T0 in patients with AN at 3 time points. Unpaired t test, **p < 0.01.

