Figure 3.

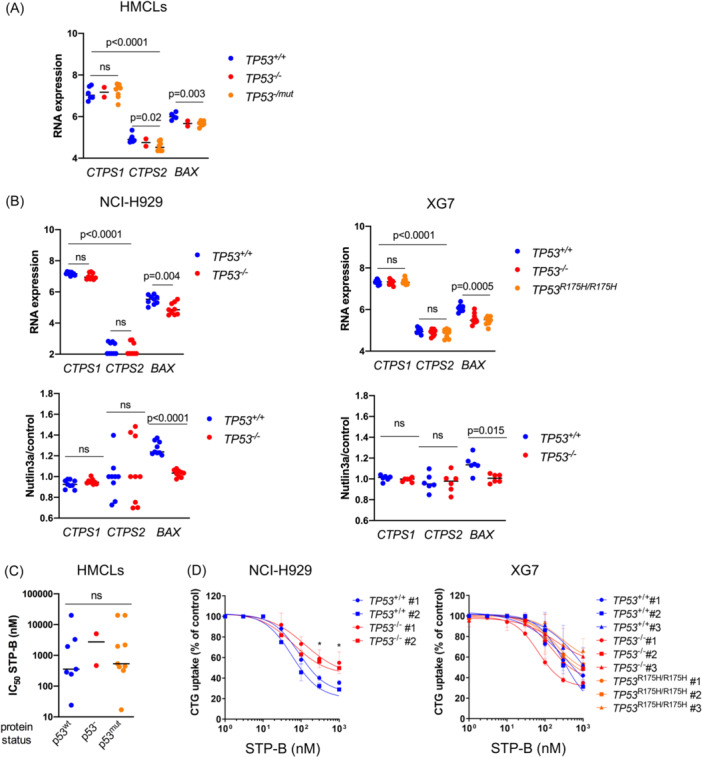
CTP synthase 1 (CTPS1) expression and response to CTPS1 inhibitor are not regulated by p53. (A) CTPS1, and not CTPS2, is highly expressed in TP53 abnormal myeloma cells. CTPS1, CTPS2, and BAX expression was assessed by SRP in 16 human myeloma cell lines (HMCLs). Statistical significance was determined using the Kruskal–Wallis and Mann–Whitney tests. (B) The expression of CTPS1 and CTPS2 is not regulated by p53. Upper panel: CTPS1, CTPS2, and BAX expression was assessed using SRP in the six isogenic NCI‐H929 clones (three TP53 +/+ and three TP53 −/− clones), as well as in the nine XG7 clones (three TP53 +/+, three TP53 −/−, and three TP53 R175H/R175H). Statistical significance was determined using the Kruskal–Wallis test. Lower panel: CTPS1, CTPS2, and BAX expression was assessed using SRP in the NCI‐H929 and XG7 clones treated, or not, with Nutlin3a (10 μM in NCI‐H929 and 2 μM in XG7) for 18 h. Results are expressed as the fold expression in Nutlin3a‐treated cells over untreated cells. Statistical significance was determined using the Kruskal–Wallis and Mann–Whitney tests. (C, D) TP53 abnormal myeloma cells are sensitive to CTPS1 inhibitor STP‐B. Response to STP‐B was assessed by CellTiter‐Glo assay after 72 h of culture in (C) 18 HMCLs and in (D) TP53 isogenic clones from NCI‐H929 or XG7, as indicated. STP‐B half‐maximal inhibitory concentration (IC50) values were compared in HMCLs according to their p53 protein status. STP‐B IC50 values of HMCLs and clones are detailed in Table 1. Results represent the mean of two to three independent experiments performed in triplicate. Statistical significance was determined using the Kruskal–Wallis and Mann–Whitney tests. ns, Not significant.
