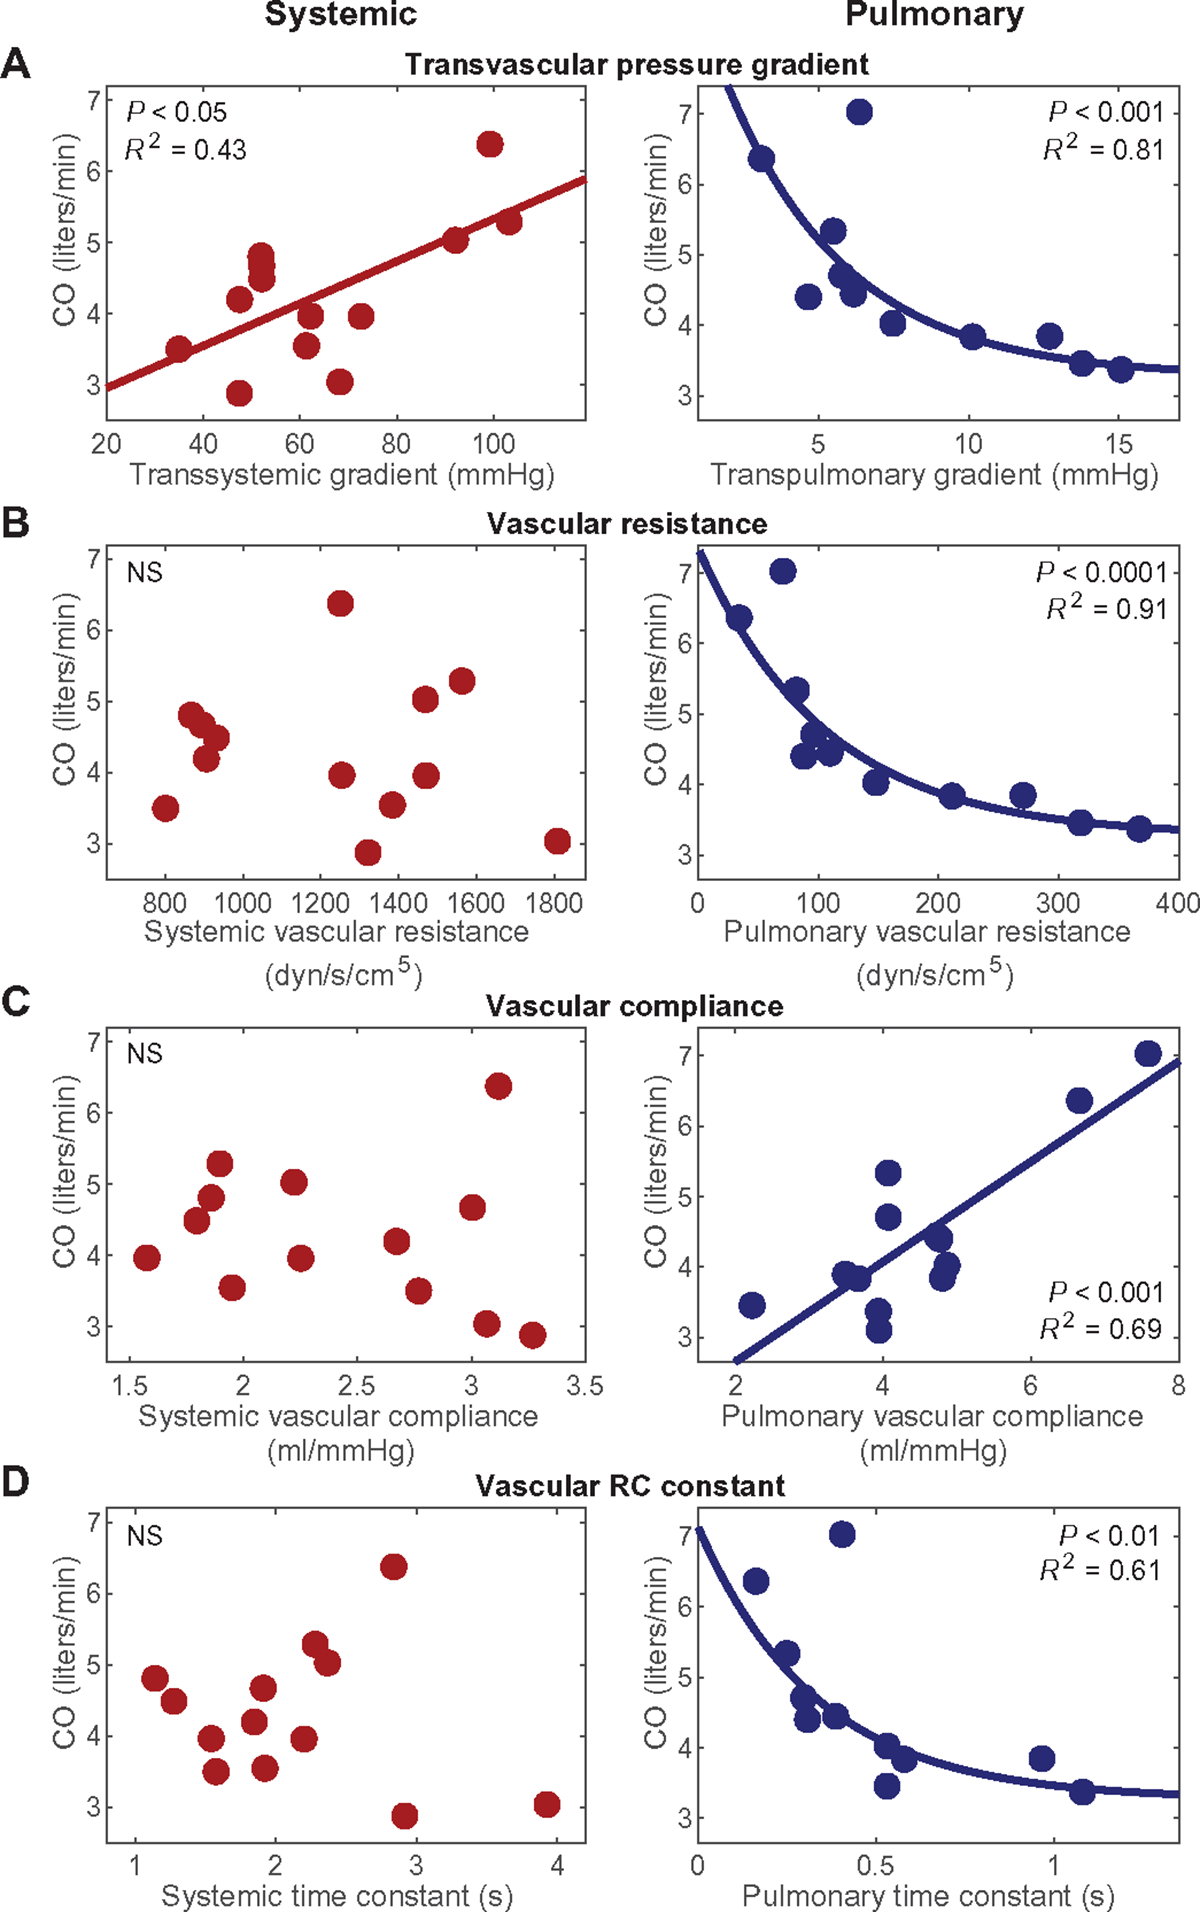
Fig. 2. Differences in systemic and pulmonary vascular mechanics.

The figure presents cardiac output across the spectrum of states modeled in the five animals with pVAD support in response to four different factors: (A) transsystemic pressure gradient (mean arterial pressure–right ventricular end-diastolic pressure) (P < 0.05) and transpulmonary pressure gradient (mean pulmonary arterial pressure–left ventricular end-diastolic pressure) (P < 0.001), (B) systemic vascular resistance (NS) and pulmonary vascular resistance (P < 0.001), (C) aortic compliance (NS) and pulmonary vascular compliance (P < 0.001), and (D) systemic RC time constant (NS) and pulmonary RC time constant (P < 0.01). N = 13 states with triplicate thermodilution, with constant pVAD speed (N = 11 for measurements involving transpulmonary pressure gradient due to catheter disruption). Linear regression was performed to confirm validity of trends. Corresponding curves and the square of the multiple correlation coefficient are denoted for correlations of statistical significance, determined by P value < 0.05.
