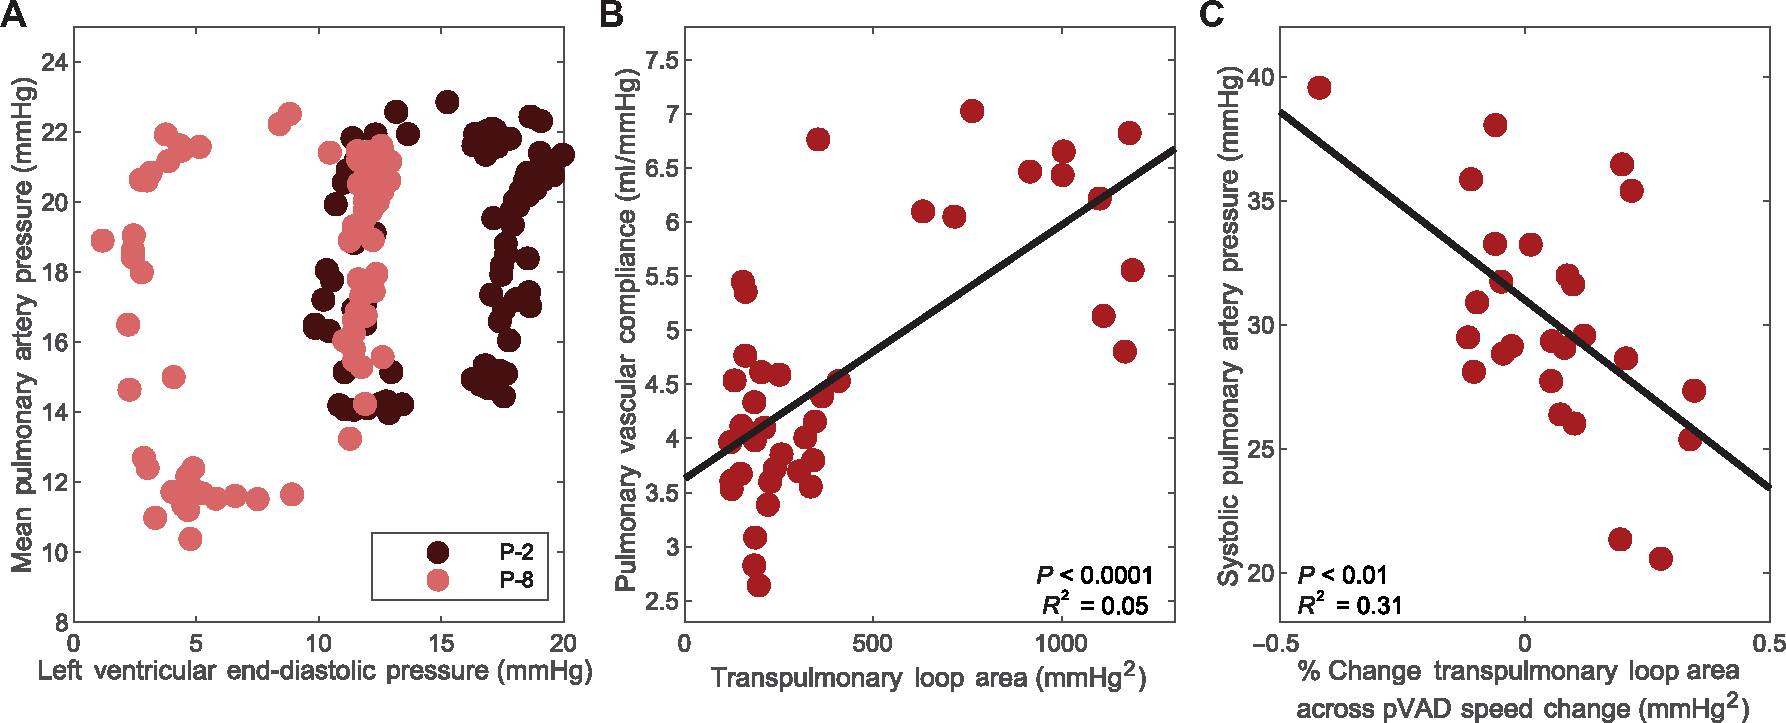
Fig. 6. Human pVAD speed sweeps validate prediction platform.

Trends across pVAD speed sweeps are shown for a corresponding retrospective dataset of eight human patients with pVAD support during high-risk percutaneous coronary intervention. (A) Shown is an example of transpulmonary hysteresis loops for one patient at low and high pVAD speeds. (B) The correlation between pulmonary vascular compliance and area of the transpulmonary hysteresis loops is presented for the spectrum of states across the eight patients. N = 40 states assessed, P < 0.0001. (C) The corresponding trend between right heart tolerance to left ventricular support, measured by systolic pulmonary artery pressure, related to percent change in transpulmonary loop area is shown for the spectrum of states across all eight patients. N = 26 pVAD speed changes, P < 0.01. Corresponding curves and the square of the multiple correlation coefficient are denoted for correlations of statistical significance, determined by P value < 0.05.
