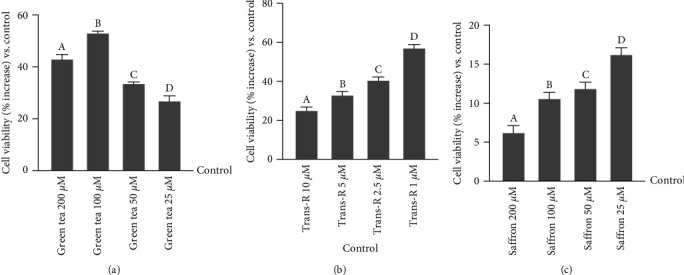
Figure 1.

Dose-response study on cell viability in CCF-STTG1 cells tested by MTT test. (a) Dose-response study after green tea administration titrated 40% EGCG (200−25 µM). The results are expressed as mean ± SD (%) of five independent experiments normalised to the control (0 lines corresponding to 100% cell viability), each performed in triplicate and expressed as the percentage increased. a, b, c and d p < 0.05 vs. control; a is p < 0.05 vs. c and d; b is p < 0.05 vs. a, c and d; c is p < 0.05 vs. d. (b) Dose-response study after trans-R administration (10−1 µM). The results are expressed as mean ± SD (%) of five independent experiments normalised to the control (0 line corresponding to 100% cell viability), each performed in triplicate and expressed as the percentage increased. a, b, c and d p < 0.05 vs. control; b is p < 0.05vs a; c is p < 0.05 vs. a and b; d is p < 0.05 vs. a, b and c. (c) Dose-response study after saffron administration titrated 0.3% crocin (200−25 µM). The results are expressed as mean ± SD (%) of five independent experiments normalised to the control (0 line corresponding to 100% cell viability), each performed in triplicate and expressed as the percentage increased. a, b, c and d p < 0.05 vs. control; b and c are p < 0.05 vs. a; d is p < 0.05 vs. a, b and c.
