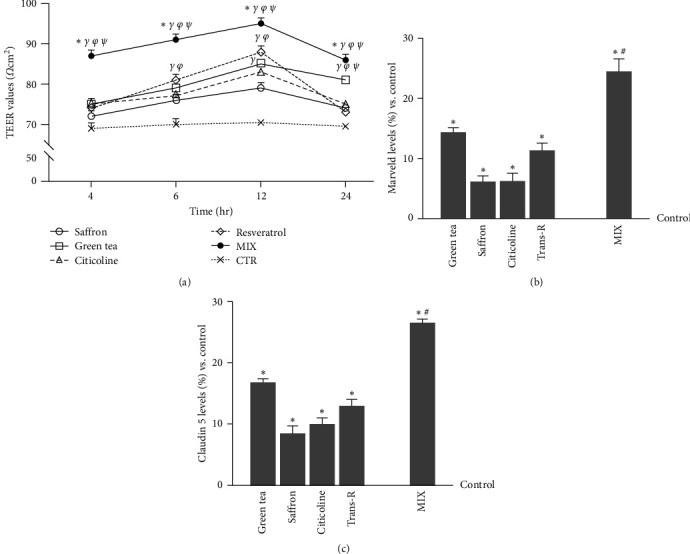
Figure 4.

The integrity of BBB in vitro model. (a) the TEER values were measured using EVOM3. The breakpoint between the axes corresponds to the threshold value below which the experimental model does not mature. The abbreviations are the same as in Figure 2. The data are expressed as means ± SD (%) of five independent experiments performed in triplicates. All agents are p < 0.05 vs. control; ∗p < 0.05 vs. green tea; γp < 0.05 vs. saffron; φp < 0.05 vs. citicoline; ψp < 0.05 vs. trans-R. (b) marveld and (c) claudin 5 levels were measured by the ELISA Kit under the same conditions as the TEER analysis. The abbreviations are the same as in Figure 2. The data are expressed as means ± SD (%) of five independent experiments normalised to control values (0% line), each performed in triplicates. ∗p < 0.05 vs. control; #p < 0.05 vs. green tea, saffron, citicoline, and trans-R.
