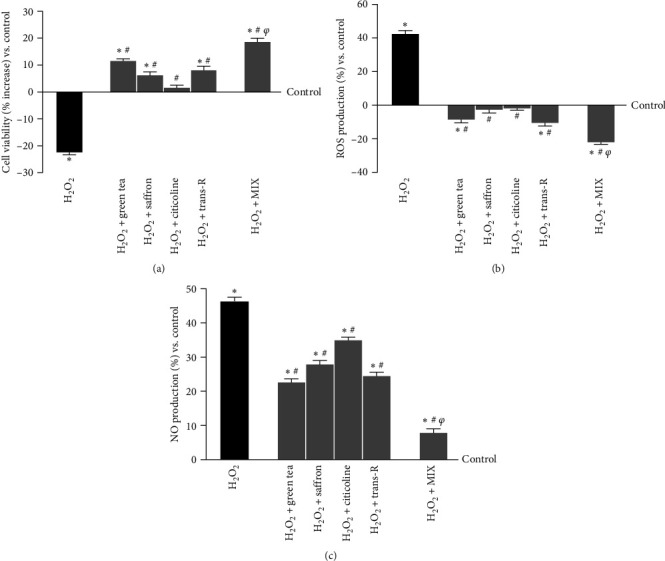
Figure 5.

Analysis of the stimulation under oxidative stress conditions on CCF-STTG1 cells. (a) cell viability (percentage increased), (b) ROS production, and (c) NO production measured on CCF-STTG1 cells pretreated with H2O2 200 μM and then treated for 24 hr with the agents alone and MIX are illustrated. H2O2 = 200 μM H2O2; H2O2 + green tea = 200 μM H2O2 + green tea titrated 40% EGCG = 100 μM; H2O2; H2O2 + saffron = 200 μM H2O2 + saffron titrated 0.3% crocin = 25 μM; H2O2; H2O2 + citicoline = 200 μM H2O2 + 100 µM citicoline; H2O2 + trans-R = 200 μM H2O2 + 1 µM trans-R; H2O2 + MIX = 200 μM H2O2 + green tea 100 μM + saffron 25 μM + citicoline 100 µM + trans-R 1 µM. The results are expressed as mean ± SD (%) of 5 independent experiments performed in triplicates normalised to control (0% line). ∗p < 0.05 vs. control; #p < 0.05 vs. H2O2; φp < 0.05 vs. green tea, saffron, citicoline, and trans-R.
