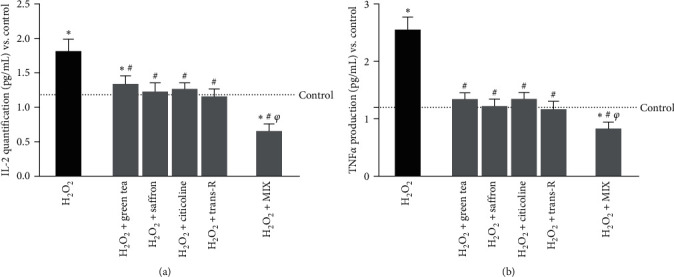
Figure 6.

Analysis of the inflammatory panel on CCF-STTG1 cells under oxidative stress conditions. (a) IL-2 and (b) TNFα productions were measured on CCF-STTG1 pretreated with H2O2 200 μM and then treated for 24 hr with single agents alone and MIX. The results are expressed as mean ± SD (pg/mL) of 5 independent experiments performed in triplicate. The abbreviations are the same as those used in Figure 5. ∗p < 0.05 vs. control; #p < 0.05 vs. H2O2; φp < 0.05 vs. green tea, saffron, citicoline, and trans-R.
