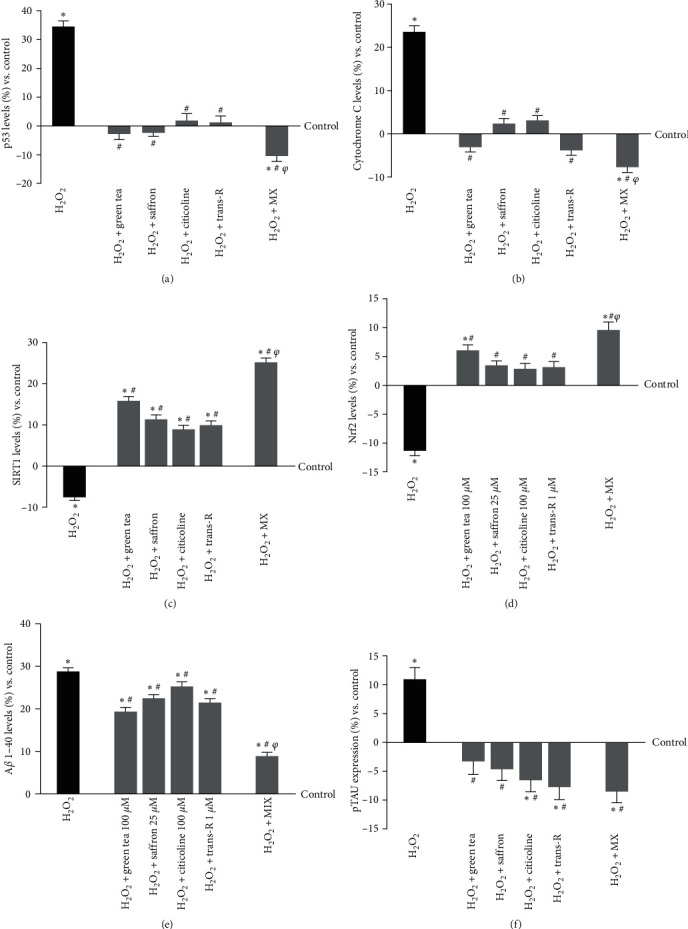
Figure 8.

Analysis of biomarkers activity in CCF-STTG1 cells under oxidative stress condition. (a) p53, (b) cytochrome C (c), SIRT-1, (d) Nrf2, (e) Aβ 1-40, and (f) pTAU protein were reported. The tests were performed on CCF-STTG1 cells pretreated with H2O2 200 μM and then treated for 24 hr with single agents alone and MIX. The abbreviations are the same as those used in Figure 5. The results are expressed as mean ± SD (%) of five independent experiments normalised to control, each performed in triplicate. ∗p < 0.05 vs. control; #p < 0.05 vs. H2O2; φp < 0.05 vs. green tea, saffron, citicoline, and trans-R.
