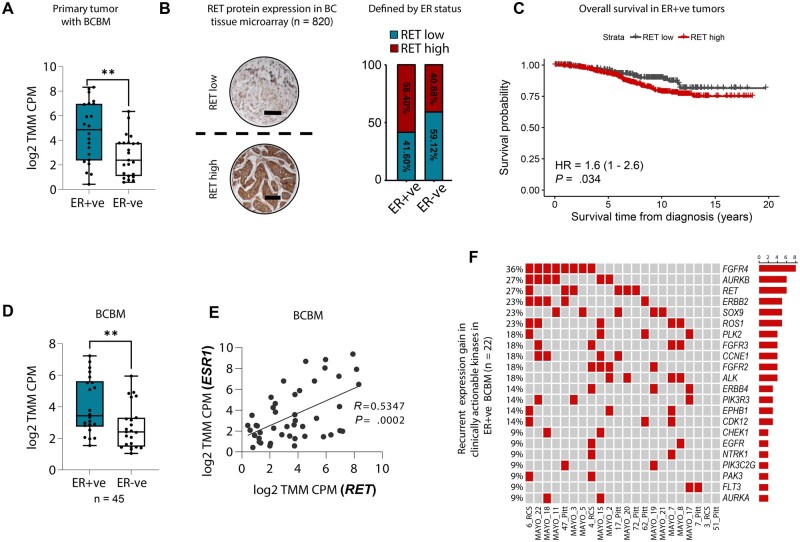
Figure 1.
RET is a key player in estrogen receptor–positive breast cancer brain metastasis. A) RET gene expression based on estrogen receptor expression in primary tumors with BCBM (n = 45 patients). Whiskers go from the minimum to the maximum value. The P value was obtained using a 2-tailed t test. **P < .01. B) Representative images of immunohistochemical staining of RET protein on a tissue microarray (n = 820) of BC samples. Scale bars, 100 μm. Dashed line represents the cutoff for RET high and RET low expression samples. RET high and RET low cutoff (immunohistochemical cutoff score = 300) was obtained with the ROC curve (left). The percentage of RET high and RET low in the ER+ve (n = 661) and ER-ve (n = 159) patient population (right). C) Kaplan-Meier analysis of overall survival in ER+ve BC tissue (n = 661). D) RET gene expression in BCBM comparing ER-ve (n = 23) and ER+ve (n = 22) patient samples. The P value was obtained using a 2-tailed t test. **P < .01. E) Correlation of ESR1 and RET gene expression (log2 TMM CPM) in BCBM patient samples (n = 45). The P value was obtained using a 2-tailed Pearson correlation test. F) OncoPrint of clinically actionable kinases with discrete expression gains in ER+ve BCBM patient samples (n = 45). BC = Breast Cancer; BCBM = Breast Cancer Brain Metastasis; ER+ve = Estrogen-Receptor positive; ER-ve = Estrogen-Receptor negative; ROC = Receiver Operating Characteristic curve.

