Figure 3.
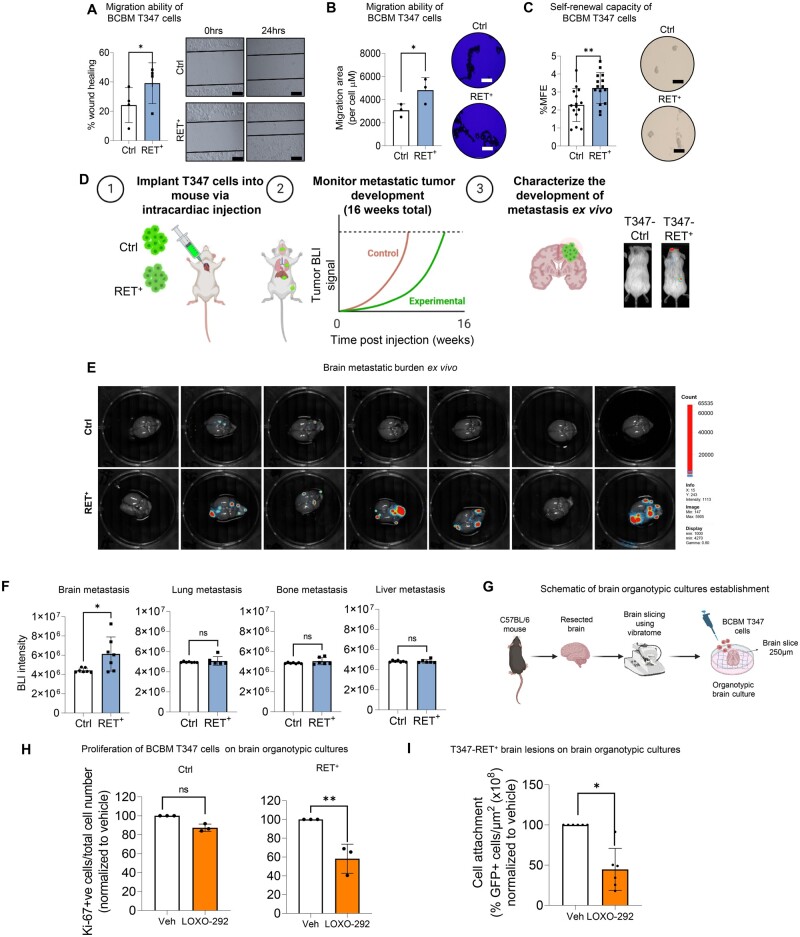
Constitutively increased expression of RET mediates brain-specific metastasis development and homing. A) In vitro migration ability of BCBM T347-Ctrl and T347-RET+ cells after 24 hours, measured with a wound healing assay (n = 4 biological replicates per cell line). Graph shows the percentage of wound closing compared to time zero (mean [SD]). Representative images (scale bar, 200 µm) at time 0 hours and 24 hours after the scratch was made. Two-sided paired t test. *P < .05. B) A Cellomics Cell Motility Kit was used to assess individual cell movement in collagen in a 96-well plate after 24 hours. Representative images of cells after fixing and staining (scale bars represent 200 μm). The mean migratory area per cell (μm) is shown on the graph (n = 3 biological replicates per cell line). Two-sided paired t test. *P < .05. C) Self-renewal capacity of T347-RET+ and T347-Ctrl cells was measured by mammosphere formation assay. Second-generation mammospheres (>50 µm) were counted under a microscope and presented as mammosphere formation efficiency (mean [SD]). Two-sided unpaired t test. **P < .005 (n = 3 biological replicates). D) Graphical representation of the experimental design. Mice were injected intracardialy with T347-Ctrl or T347-RET+ cells (n = 7 mice per cell line) and monitored over 16 weeks. This schematic was created using elements from Biorender (https://biorender.com/). E) At end of experiment (16 weeks) ex vivo brain BLI images were taken. F) Quantification of ex vivo brain BLI in brain, lung, bone and liver. The bar graph represents mean brain BLI values (n = 6 - 7 mice per cell line). Two-sided Mann-Whitney t test. P = ns, statistically non significant. *P < .05. G) Graphical representation of brain organotypic culture establishment. This scheme was created using elements from Biorender (https://biorender.com/). H) Ki-67% (proliferation index) analyzed by immunofluorescence after 72 hours of treatment of T347-Ctrl and T347-RET+ brain organotypic cultures with Veh (DMSO) or LOXO-292 (10 µM). Two-sided unpaired t test. P = ns, statistically non significant; **P < .01. (bar chart mean [SD]). I) Quantification of T347-RET+ cells’ attachment to the brain organotypic cultures after treatment with Veh (DMSO) or LOXO-292 (10 µM) (n = 6 brain organotypic cultures). BCBM cell lesion areas are normalized to the brain slice area for each replicate. Graph values are normalized to the control treated with DMSO. The bar chart shows mean [SD]. Two-sided Mann-Whitney t test, *P < .05. BCBM = Breast Cancer Brain Metastasis; Veh = vehicle; MFE = mammosphere formation efficiency; BLI = bioluminescence.

