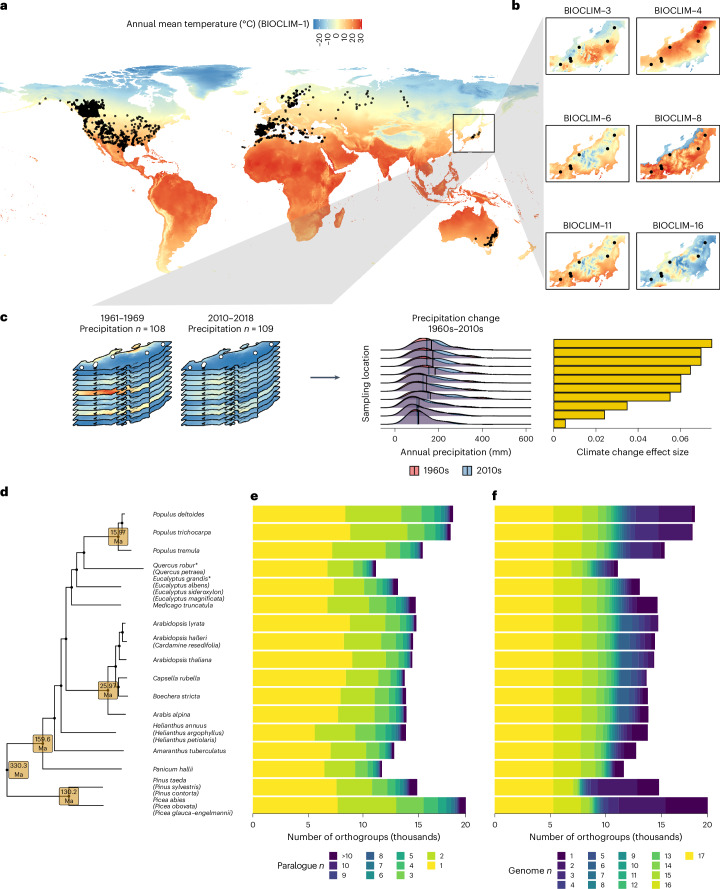
Fig. 1. Summary of study design and orthology assignment among species.
a, Sampling locations from all 29 datasets (25 species) and global annual mean temperature. b, An example of six bioclim variables across a single dataset with ten sampling locations from ref. 65. c, An example for the same dataset showing how climate change variables were calculated, taking monthly climate data from the 1960s and 2010s and calculating the effect size of the difference between decades. d, The species tree derived from the OrthoFinder2 analysis for the 17 reference genomes used in this study; species where a reference genome assembly was used to map related species but that species was not included in analyses, are marked with asterisks. The reference genome assembly at each tip came from the species not listed in brackets and species listed in brackets below had their data mapped onto that reference genome. The age of high-confidence nodes is shown with values pulled from TimeTree (Extended Data Fig. 1). Species analysed here are placed according to the reference genome used and the reference’s position in the tree. e,f, The per genome distribution of the number of paralogues per orthogroup (e) and number of representative genomes per orthogroup (f) are depicted as stacked bars, with bar fill scaling from light-to-dark according to most- to least-statistically tractable value. Bars are ordered vertically in line with the tree in d. Ma, million years ago.

