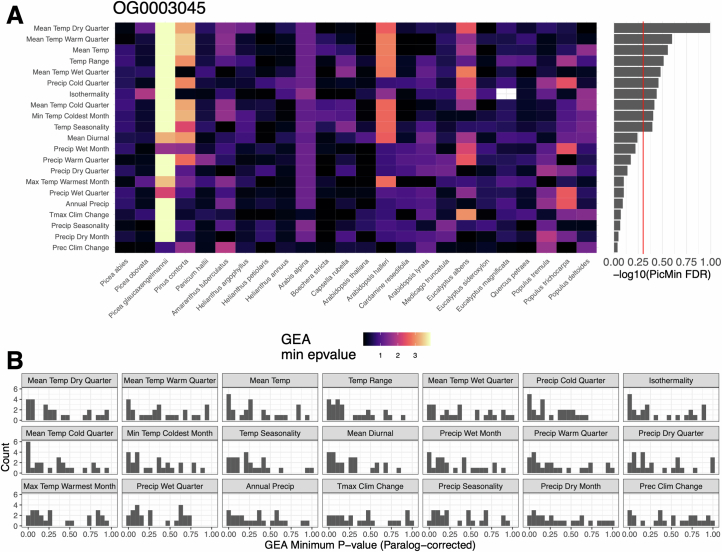
Extended Data Fig. 5. Summary of PicMin results for the orthogroup with the strongest evidence of repeatability across the most climate variables: OG0003045 (Arabidopsis thaliana genes PRR3 and PRR7).
Heatmap in (A) shows the per species -log10-transformed GEA p-value for each species and climate variable. Note that isothermality is absent for Eucalyptus magnificata as there was no climate variation here. Alongside the heatmap, the -log10-transformed PicMin FDR values are shown, and rows are ordered according to the most significant to least significant. Individual GEA p-value vectors are plotted as histograms in (B), with the most significant in terms of PicMin FDR shown in top-left through to least significant in bottom-right.

