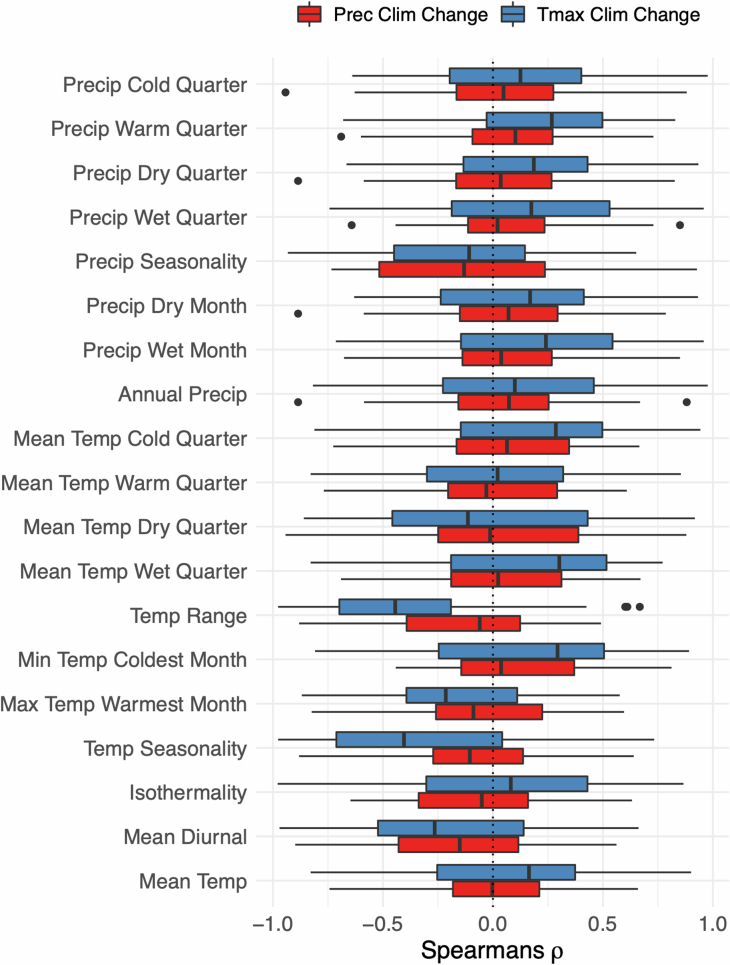
Extended Data Fig. 6. Correlations between climate change variables and other bioclim variables across all individual datasets.
Each boxplot shows the non-parametric correlation coefficients calculated across all individual datasets (N = 29 biological replicates) between either precipitation climate change or maximum temperature climate change. Each box shows the median, quartiles, standard range (1.5 x IQR) and points show outliers beyond the standard range. Deviations from the central x = 0 are indicative of persistent association between a climate change variable and a given bioclim variable.

