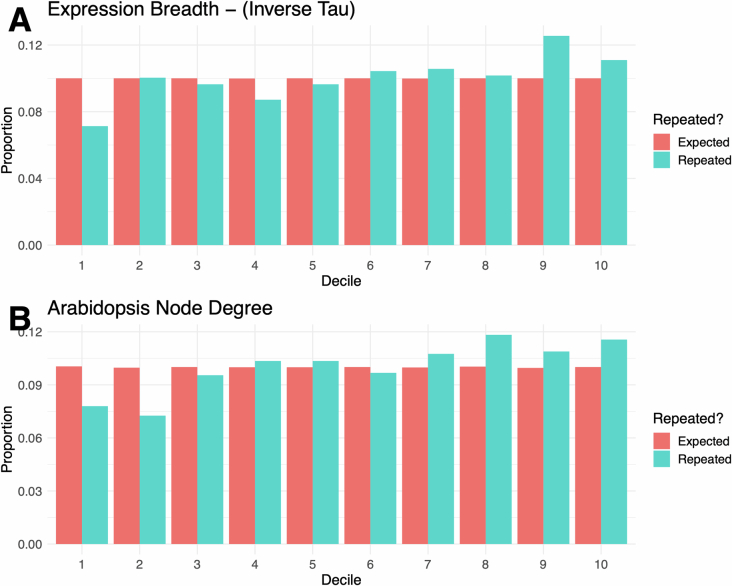
Extended Data Fig. 7. Decile enrichment of pleiotropy measures in orthogroups exhibiting strongest evidence of repeatability (PicMin p-value < 0.005).
Each pair of bars shows the proportion of Arabidopsis thaliana genes belonging to the relevant decile based on either specificity of tissue expression (A) or co-expression node degree (B), relative to the random expectation (red bars). Deciles are ordered 1-10 from least to most pleiotropic.

