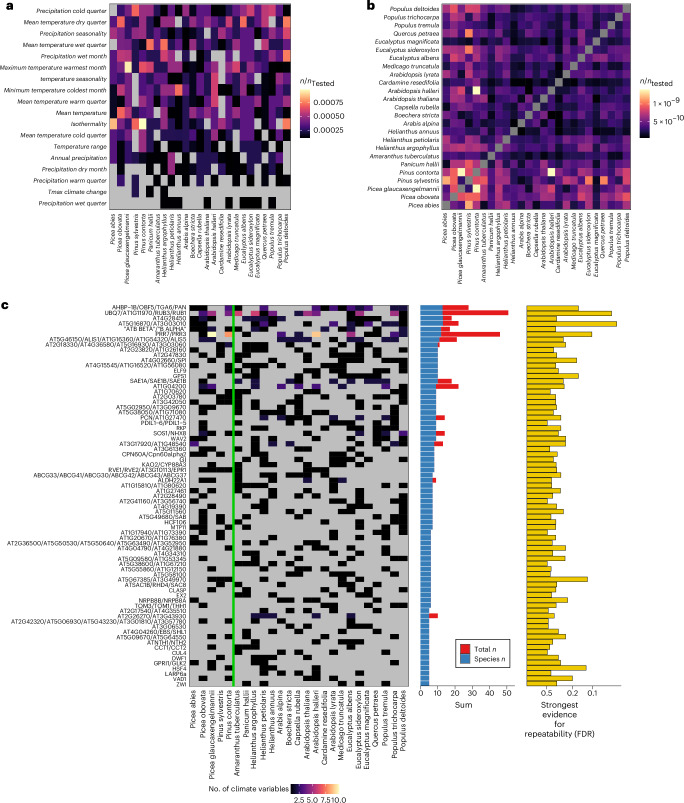
Fig. 3. Signatures of repeatability split across climate variables and species.
a,b, Heatmaps show the contribution of individual species to orthogroup repeatability at FDR < 0.5 for different climate variables (a) and among pairs of species (b), with species ordered phylogenetically. In each case, the fill of each cell represents the proportion of orthogroups where a given species contributes towards the signature of repeatability based on its minimum GEA P value. c, Heatmap showing the number of times a species contributes towards repeatability for a given RAO (FDR < 0.5). In c, cell fill denotes the number of climate variables where a species contributes a low P value to a given RAO, with grey being 0. The vertical green line separates gymnosperms and angiosperms. Row-wise summations are shown as bars, where the blue bar shows the number of species associated with a given orthogroup (species n) and the red bar shows the total number of species and climate variables (total n). RAOs associated with a single climate variable only have a blue bar and those with stacked red bars are RAOs associated with multiple climate variables. The strongest statistical support for repeatability is also shown per orthogroup as −log10-transformed FDR. Only 73 RAOs with at least five contributing species are shown.

