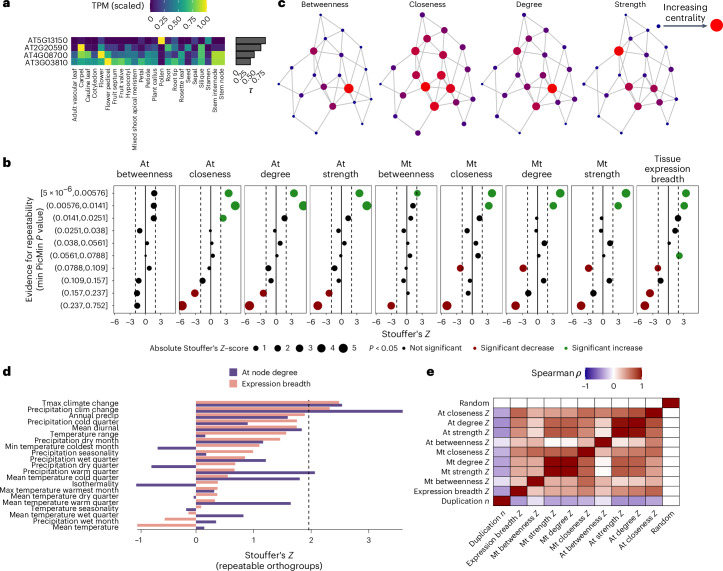
Fig. 5. Associations between pleiotropy and orthogroup repeatability.
a, An example of breadth of tissue expression. Each cell in the heatmap shows tissue-specific gene expression scaled by the maximum across all tissues for five genes, with their τ statistic as a bar. b, Stouffer’s Z calculated for orthogroups grouped into deciles on the basis of the strongest evidence of repeatability across all climate variables (green, P < 0.05 more pleiotropic than expected; red, P < 0.05 less pleiotropic than expected). c, An example network of 20 genes with four centrality measures calculated across nodes. Node size and colour (small-blue, low; large-red, high) denotes centrality by each metric. d, Stouffer’s Z for node degree and tissue specificity metrics within climate variables, focussing on orthogroups with at least one PicMin P < 0.005. e, Non-parametric correlations of per orthogroup pleiotropy and duplication metrics, along with a randomized control variable. At, A. thaliana; Mt, M. truncatula.

