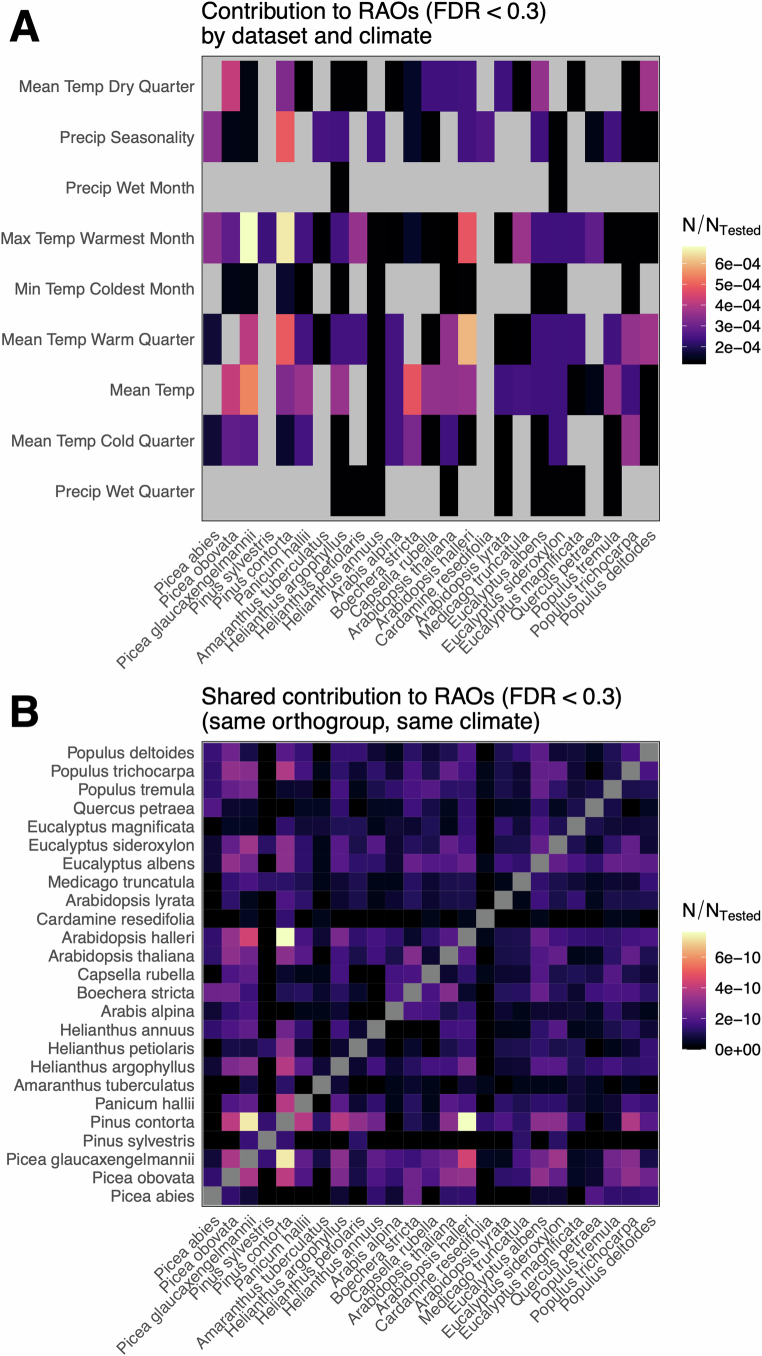
Extended Data Fig. 3. Species contributions to repeatability in RAOs with PicMin FDR <0.3.
Heatmaps show the contribution of individual species to orthogroup repeatability at FDR < 0.3 for different climate variables (A) and among pairs of species (B), with species ordered phylogenetically. In each case, the fill of each cell represents the proportion of orthogroups where a given species contributes towards the signature of repeatability based on its minimum GEA p-value.

