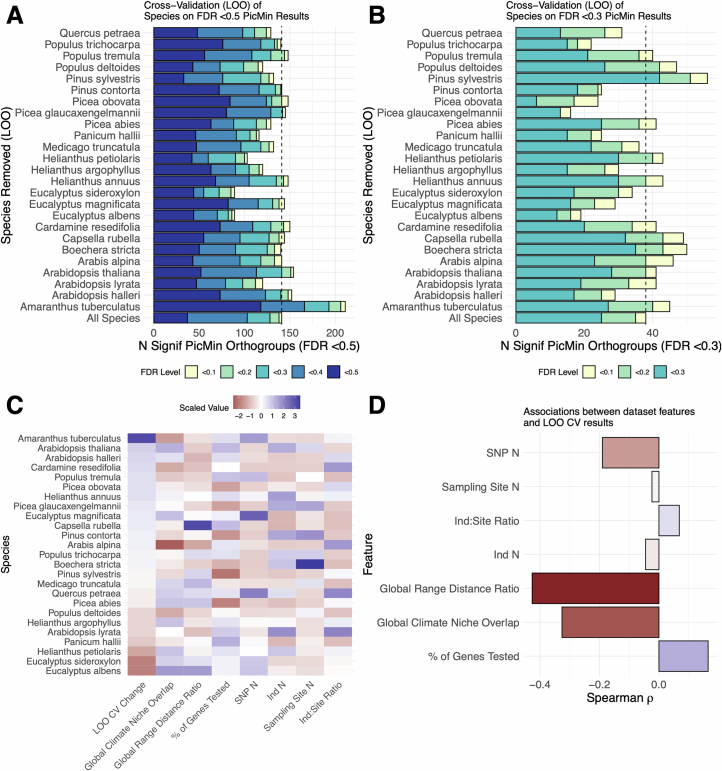
Extended Data Fig. 4. Leave-one-out cross validation results for PicMin repeatability analyses.
Panels A (FDR <0.5) and B (FDR <0.3) show stacked bars for RAOs identified when removing one species and testing the remaining 24, alongside the full 25 species dataset (vertical dashed line). The heatmap in C shows how the change in RAO number varied by species (LOO CV Change), alongside other features of species datasets including the breadth of sampling (geographically and climatically) relative to the total species range, and technical features related to genome sequencing and sample size (see Supplementary Results 5). The association between dataset features and the cross-validation results are shown as correlation coefficients in panel D. Negative correlation coefficients imply that removing datasets with lower dataset feature values increases the number of RAOs, and vice versa.

