Fig. 2.
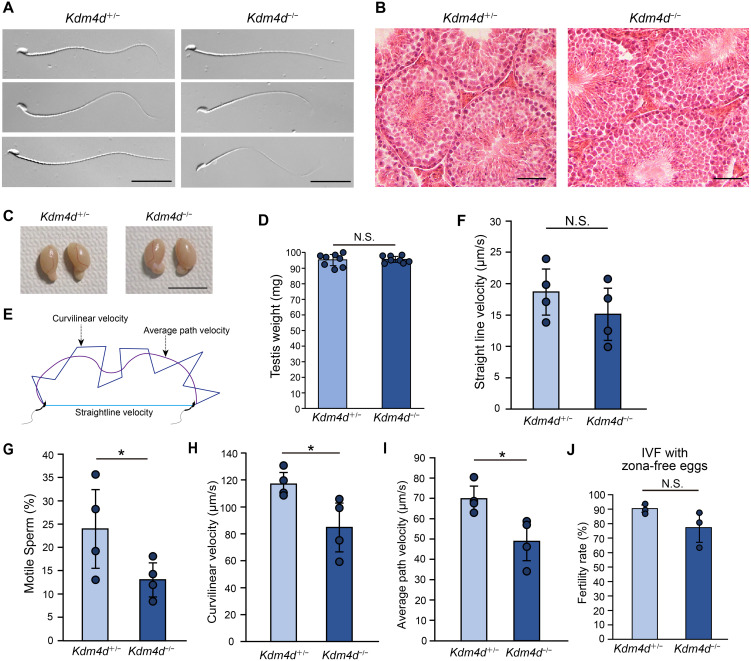
Kdm4d mutant mice display impaired sperm motility. (A) Morphology of sperm from Kdm4d mutant mice. Scale bar, 30 μm. (B) HE-staining of testis sections. Scale bar, 50 μm. (C) Morphology of testis from Kdm4d mutant mice. Scale bar, 1 cm. (D) Weight of testis from Kdm4d mutant mice. Mean ± SD are indicated. N.S., not significant (Student’s t-test). Four independent male mice were used for each experimental group. (E) Schematic representation of sperm motility analysis. (F–I) Sperm motility indices. Straightline velocity (F), fraction of motile sperm (G), curvilinear velocity (H), and average path velocity (I) are shown. Mean ± SD are indicated. * P < 0.05 (Student’s t-test). Four independent male mice were used for each experimental group. (J) Fertility rate upon in vitro fertilization. Data are shown as in Fig. 1H except that zona-free eggs were used in this assay. N.S., not significant (Student’s t-test). Three independent male mice were used for each experimental group.

