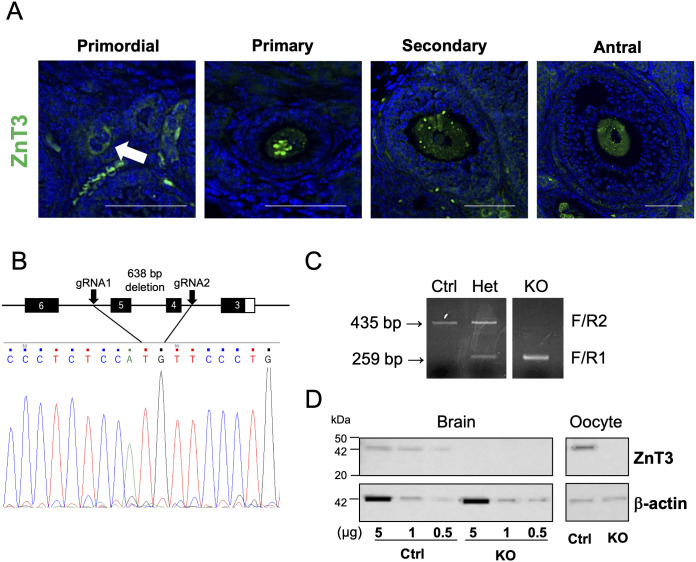
Fig. 1.
Generation of ZnT3 knockout mice. (A) The expression of ZNT3 in a mouse ovary. ZNT3 (green) is observed in oocyte cytoplasm but not in the plasma membrane surface. The blue shows nucleus. The arrow indicates a primordial follicular oocyte. The scale bars represent 50 µm. (B) Deletion mapping by Sanger sequencing analysis showed deletion of the 638-bp ZnT3 gene including exon 4-5. (C) Genotyping of ZnT3 alleles. Primers F and R1 amplified a 259-bp amplicon for the KO alleles, and primers F and R2 amplified a 435-bp amplicon for WT alleles. (D) Western blot analysis of the brain and oocytes from Ctrl and ZnT3 KO mice. Concentrations of 0.5, 1, and 5 µg were applied to determine the amount of protein reacting with the anti-ZnT3 antibody in the brain. One hundred MII oocytes were used in order to detect oocyte expression. The expected molecular weight for ZNT3 is 42 kDa. Expression level of β-actin (42 kDa) served as a protein loading control. Molecular mass is indicated at the left.

