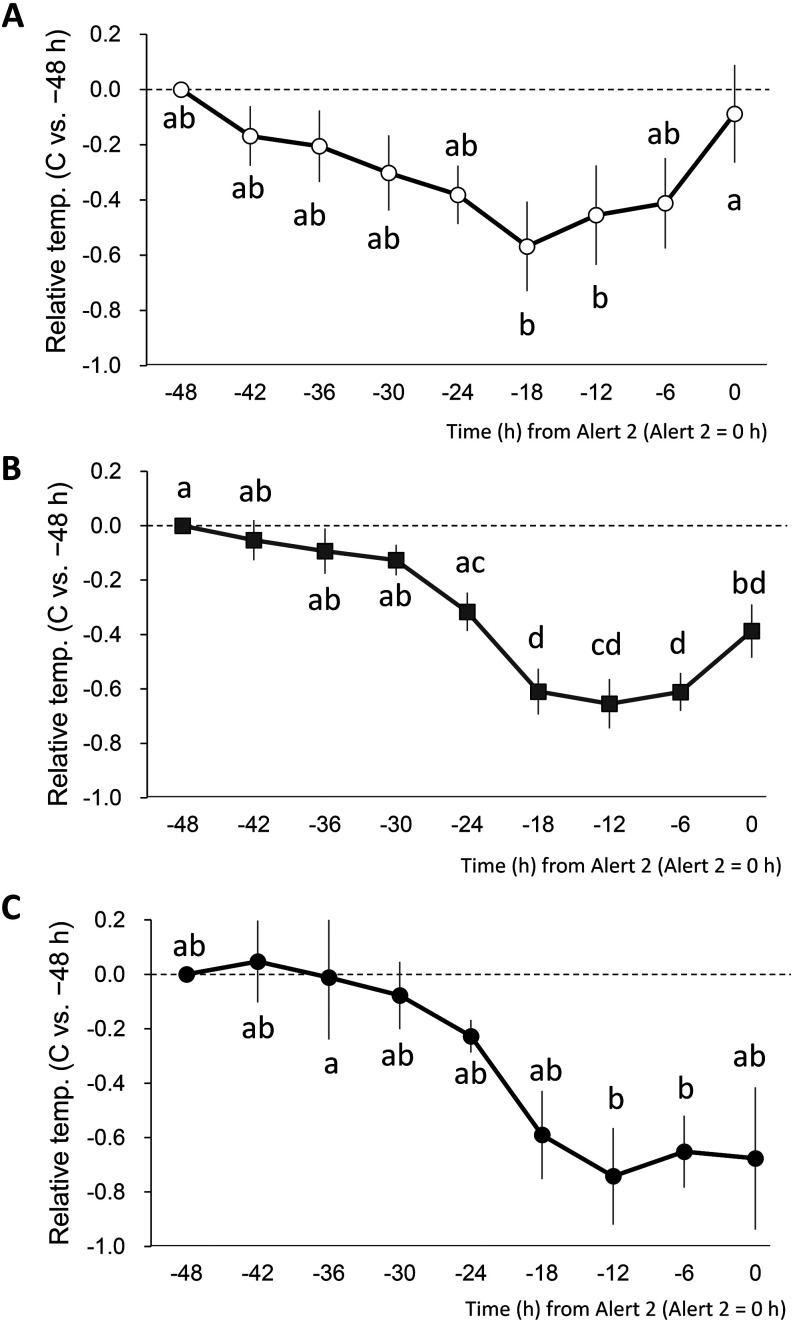
Fig. 3.
The association between the calving duration and PE time and the relative vaginal temperature changes from 48 h before Alert 2. PE times were categorized into four categories: 0–4 h (n = 12), 4–8 h (n = 26), 8–12 h (n = 1), and RP (> 12 h, n = 7). The relative vaginal temperature for each PE category, with −48 h (0 h = Alert 2, the time of sensor dropout) as the reference (= 0), is shown as every 6 h mean ± standard error. The PE time = 0–4 h (n = 12, A), 4–8 h (n = 26, B), and RP (> 12 h, n = 7, C). Different letters indicate P < 0.05. No significant differences were observed when the common letters were included.

