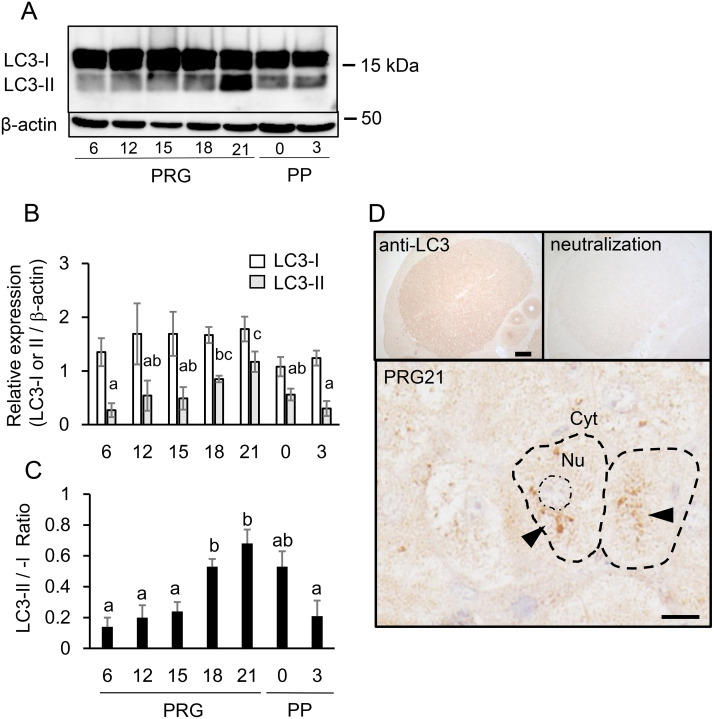
Fig. 2.
Expression of LC3 proteins in CL tissue. (A) Typical immunoblots of LC3-I and -II in CL tissue throughout pregnancy and postpartum. (B) Protein expression of LC3-I and -II relative to β-actin was determined and shown (mean ± SEM, n = 6). (C) Ratio of LC3-II to -I was calculated and shown (n = 6). Different alphabetical letters in each Fig. B (LC3-II value) and C indicate significant differences (P < 0.05). (D) Immunohistochemical staining of LC3 (to both LC3-I and –II) in CL on PRG21. Note the loss of immunoreaction after antibody neutralization and aggregative immunostaining (black triangle) in the cytoplasm. Scale bars, 200 μm (the top left) and 20 μm (the bottom).

