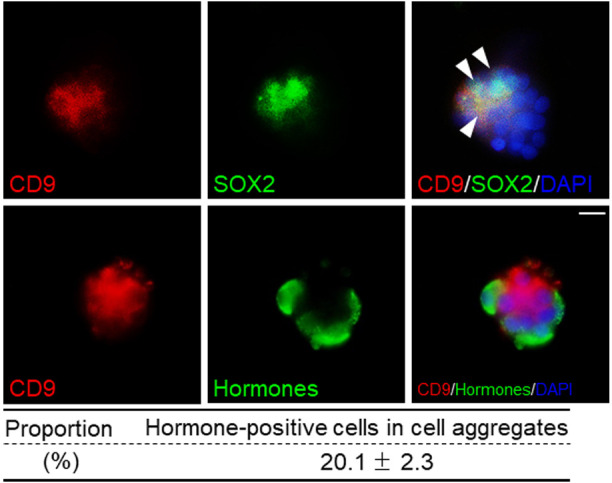
Fig. 3.

Differentiation capacity of CD9-positive cells isolated from the marginal cell layer of the intermediate lobe in 3D culture. Double immunofluorescence staining for CD9 (red) and SOX2 (upper panels, green) in CD9-positive cell aggregates after induction of differentiation. Arrowheads indicate CD9/SOX2-positive cells. Double immunofluorescence staining for CD9 (red) and hormones (GH, PRL, TSHβ, LHβ, and ACTH, stained with a mixture of antibodies) (bottom panels, green) in CD9-positive cell aggregates after induction of differentiation. Proportion of hormone-positive cells in cell aggregate is shown in the bottom table (mean ± SEM, n = 12). Scale bar: 20 μm.
