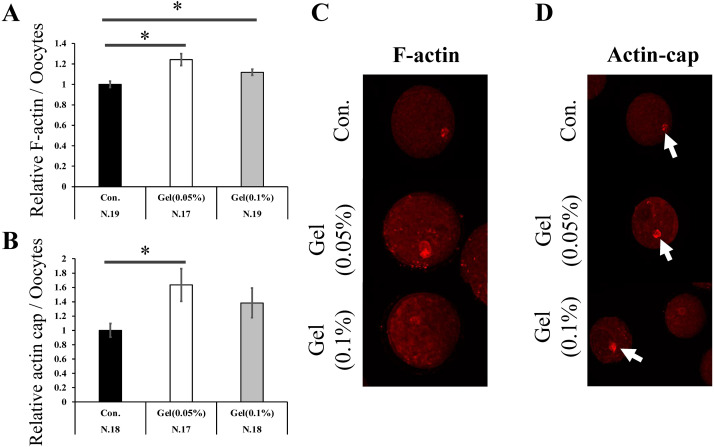
Fig. 2.
The effect of the GG gel on actin polymerization in oocytes. F-actin (A) and actin cap (B) expression levels in mature oocytes. Data were analyzed using the Tukey–Kramer test. Values for the control group (Con.) was defined as 1.0. Representative images of F-actin (C) and actin cap (D) in oocytes. Arrow, actin cap. Data are presented as the mean ± SEM, * P < 0.05. The number of samples is indicated in each figure.

