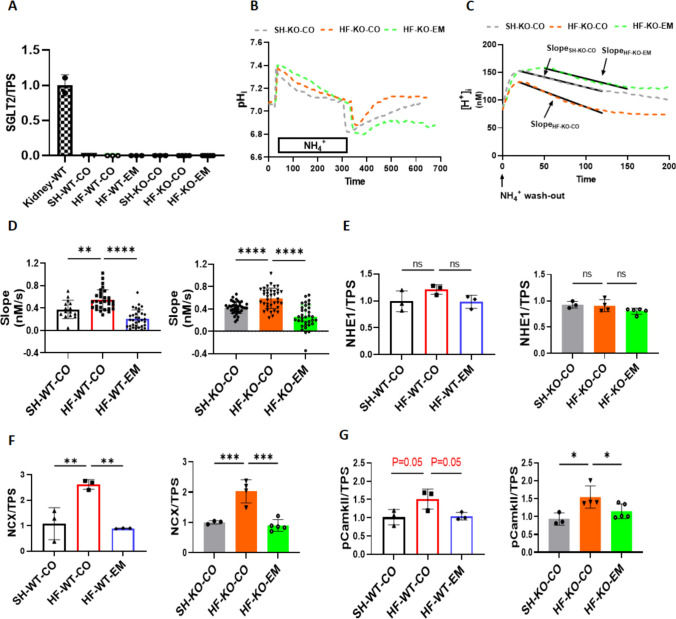
Fig. 4.
EMPA reduced HF-induced activation of NHE1, NCX expression and CamKII phosphorylation, independently of SGLT2. A Sodium glucose cotransporter 2 protein expression/total protein staining (SGLT2/TPS). B Typical example of the curve changes of intracellular pH during the whole measurement, showing the slope only for KO mice; C Typical example of the curve changes of intracellular [H+] during the first 200 s after NH4+ wash-out, showing the slope only for KO mice. D Chronic effects of EMPA on NHE1 activity as reflected by the; E Sodium hydrogen exchanger 1 protein expression/total protein staining (NHE1/TPS). F sodium calcium exchanger 1 protein expression/total protein staining (NCX/TPS). G Phosphorylation of calcium/calmodulin-dependent protein kinase expression/total protein staining (pCamkII/TPS). Data are presented as mean ± SD. *p < 0.05, **p < 0.01, *** p < 0.001, **** p < 0.0001. ns: not significant. A and E–G and G-J: SH-WT-CO (n = 3; 1 M/2F), SH-KO-CO (n = 3; 1 M/2F), HF-WT-CO (n = 3; 2 M/1F), HF-KO-CO (n = 4; 2 M/2F), HF-WT-EM (n = 3; 2 M/1F) and HF-KO-EM (n = 5; 2 M/3F). B–D SH-WT-CO (15 cells from 3 mice, 2 M/1F), SH-KO-CO (39 cells from 4 mice, 3 M/1F), HF-WT-CO (29 cells from 3 mice, 1 M/2F), HF-KO-CO (37 cells from 4 mice, 1 M/3F), HF-WT-EM(33 cells from 3 mice, 1 M/2F) and HF-KO-EM (34 cells from 3 mice, 1 M/2F). D–G One-way ANOVA with Holm-Šídák's multiple comparisons test

