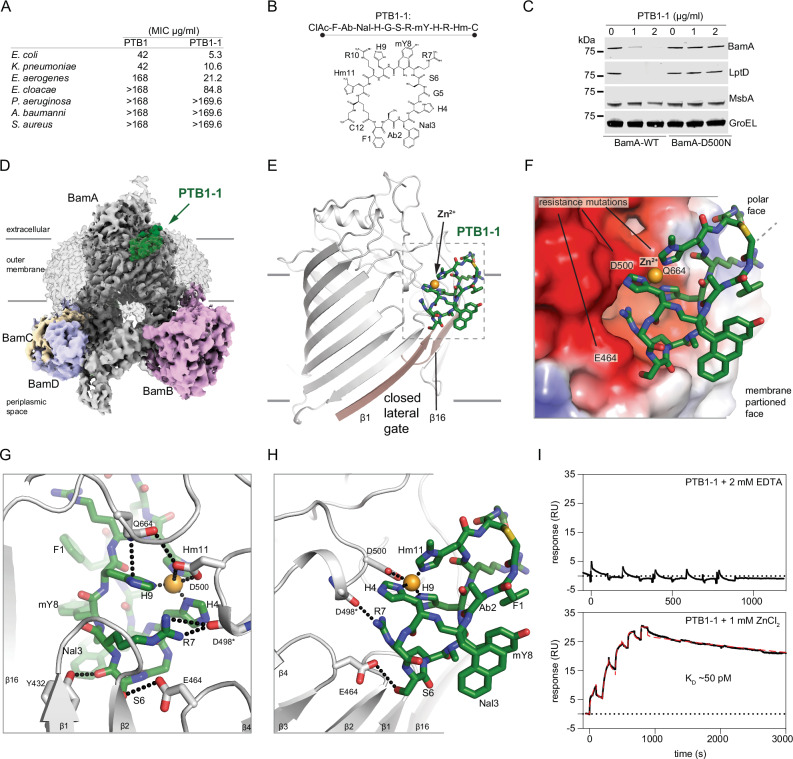
Fig. 1. Activity and cryo-EM structure of the closed-state PTB1-1–BAM complex.
A Minimal inhibitory concentrations (MICs) for BamA-binding macrocycles PTB1 and PTB1-1 on indicated bacterial species. MIC assays were performed in triplicate with mean values reported. The molecular weights of PTB1 and PTB1-1 are 1678.88 and 1705.90 g/mol, respectively. B Amino acid sequence and schematic of BamA-binding PTB1-1 macrocycle. CIAc-F (N-α-chloroacetyl-l-phenylalanine), Ab (l-α-aminobutanoic acid), Nal (β-(1-naphthyl)-l-alanine), H (l-histidine), G (glycine), S (l-serine), R (l-arginine), mY (N-α-methyl-L-tyrosine), Hm (3-methyl-l-histidine), C (l-cysteine). C Western blot of E. coli wild-type (BamA-WT) and a representative PTB1-1-resistant strain (BamA-D500N) for select outer membrane (BamA and LptD), inner membrane (MsbA), and cytoplasmic (GroEL) proteins under increasing concentrations of PTB1-1. Dashes represent location of 75 kDa molecular weight marker on each blot. This is representative of two replicates and the full blots are provided in Source Data. D Cryo-EM map of the PTB1-1–BAM–MAB2 Fab complex. Lower contours of the map that include detergent micelle and MAB2 Fab are shown in transparency. BAM subunits are labeled and BamA is shown in gray, BamB in pink, BamC in wheat, BamD in light blue, and BamE is not visible in the presented orientation. PTB1-1 is shown in green. Approximate outer membrane boundaries are indicated. E Overall view of the PTB1-1–BamA complex. PTB1-1 is shown in green, lateral gate β-strands are shown in tan, and assigned Zn2+ cation is shown as an orange sphere. Approximate outer membrane boundaries are indicated. F Electrostatics of the PTB1-1 binding site on BamA. Select positions where substitutions lead to PTB1-1 resistance are labeled and the assigned Zn2+ cation is shown as an orange sphere. Red, blue, and white represents negative, positive, and neutral charge, respectively. G and H Close-in views of the PTP1-1 interactions with BamA. BamA is shown in gray and PTB1-1 is shown in green, with direct bonding interactions indicated by dotted lines. I Duplicate SPR sensorgram of PTB1-1 interaction with surface-bound BamA in the presence of 2 mM EDTA (top) or 1 mM ZnCl2 (bottom) where the latter is fit using a two-state model, KD = (kd1/kd2)*(kd2/(ka2 + kd2)) to calculate the KD = 50 ± 2 pM in the presence of ZnCl2 (model curve is displayed as a dashed red line). No binding was observed in the presence of EDTA.

