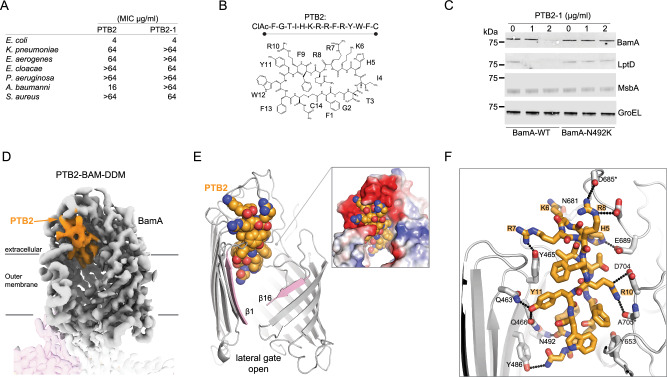
Fig. 2. Activity and cryo-EM structure of the open-state PTB2-BAM-DDM complex.
A Minimal inhibitory concentrations (MICs) for BamA-binding macrocycles of PTB2 and PTB2-1 on indicated bacterial species. MIC assays were performed in triplicate with mean values reported. The molecular weights of PTB2 and PTB2-1 are 2013.33 and 2043.40 g/mol, respectively. B Amino acid sequence and schematic of BamA-binding PTB2 marcocycle. CIAc-F (N-α-chloroacetyl-l-phenylalanine), G (glycine), T (l-threonine), I (l-isoleucine), H (l-histidine), K (l-lysine), R (l-arginine), F (l-phenylalanine), Y (l-tyrosine), W (l-tryptophan), C (l-cysteine). C Western blot of E. coli wild-type (BamA-WT) and a representative PTB2-1-resistant strain (BamA-N492K) for select outer membrane (BamA and LptD), inner membrane (MsbA), and cytoplasmic (GroEL) proteins under increasing concentrations of PTB2-1. Dashes represent the location of the 75 kDa molecular weight marker on each blot. This is representative of 2 replicates, and the full blots are provided in Source Data. D Cryo-EM map of the PTB2–BAM–DDM complex. BamA is shown in gray, BamB in pink, and BamC, BamD, and BamE are present but not labeled/shown for clarity. PTB2 bound in the central lumen is shown in orange. Lines indicate the approximate boundaries of the outer membrane. E Overall view of PTB2 bound to BamA with open lateral gate. PTB2 is shown in orange, and the lateral gate is shown in pink. The electrostatics of the PTB2 binding site are shown (inset) with red, blue, and white representing negative, positive, and neutral charges, respectively. F Close-in view of PTB2 interactions with BamA. BamA is shown in gray and PTB2 is shown in orange, with direct bonding interactions indicated by dotted lines.

