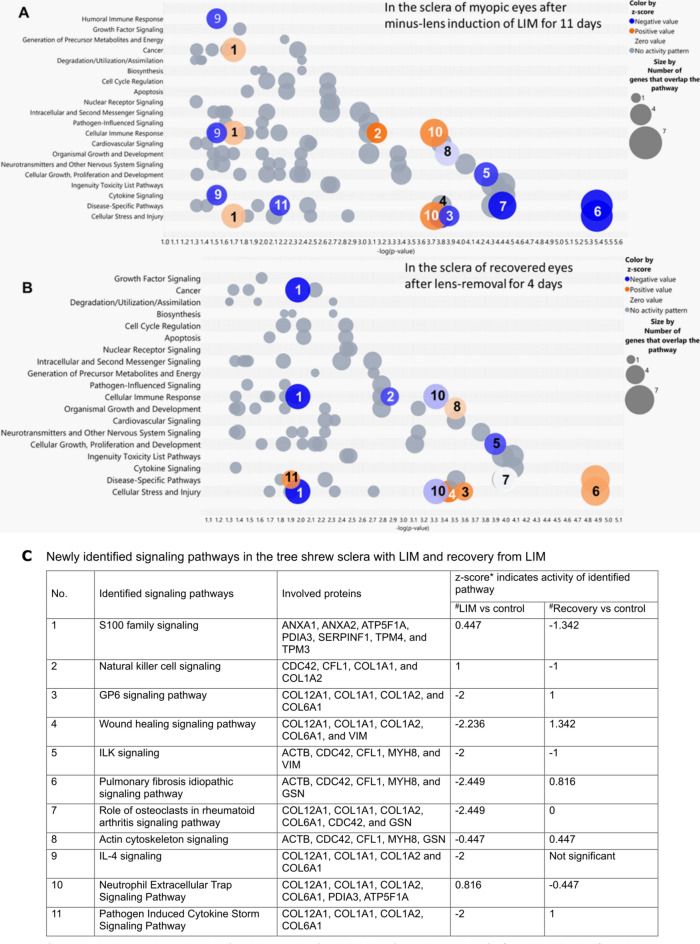
Figure 2.
Signaling pathways significantly affected in the sclera of tree shrew: (A) after 11 days of imposed minus-defocus (LIM vs contralateral eyes), and (B) after 4 days of recovery from minus-lens treatment (treated eyes vs contralateral eyes), with (C) the respective z-score of each newly identified signaling pathway of both groups. The x-axis represents statistical significance, and the y-axis represents pathway categories. Each bubble represents a signaling pathway, and the numbers inside the bubbles indicate the same signaling pathways in (A) and (B). The colors of the bubbles indicate their relative effects on the signaling pathways that were significantly affected by the experimental treatment—from low activation (pink) to high activation (orange); from low inhibition (light blue) to high inhibition (dark blue); and no net activity (gray).

