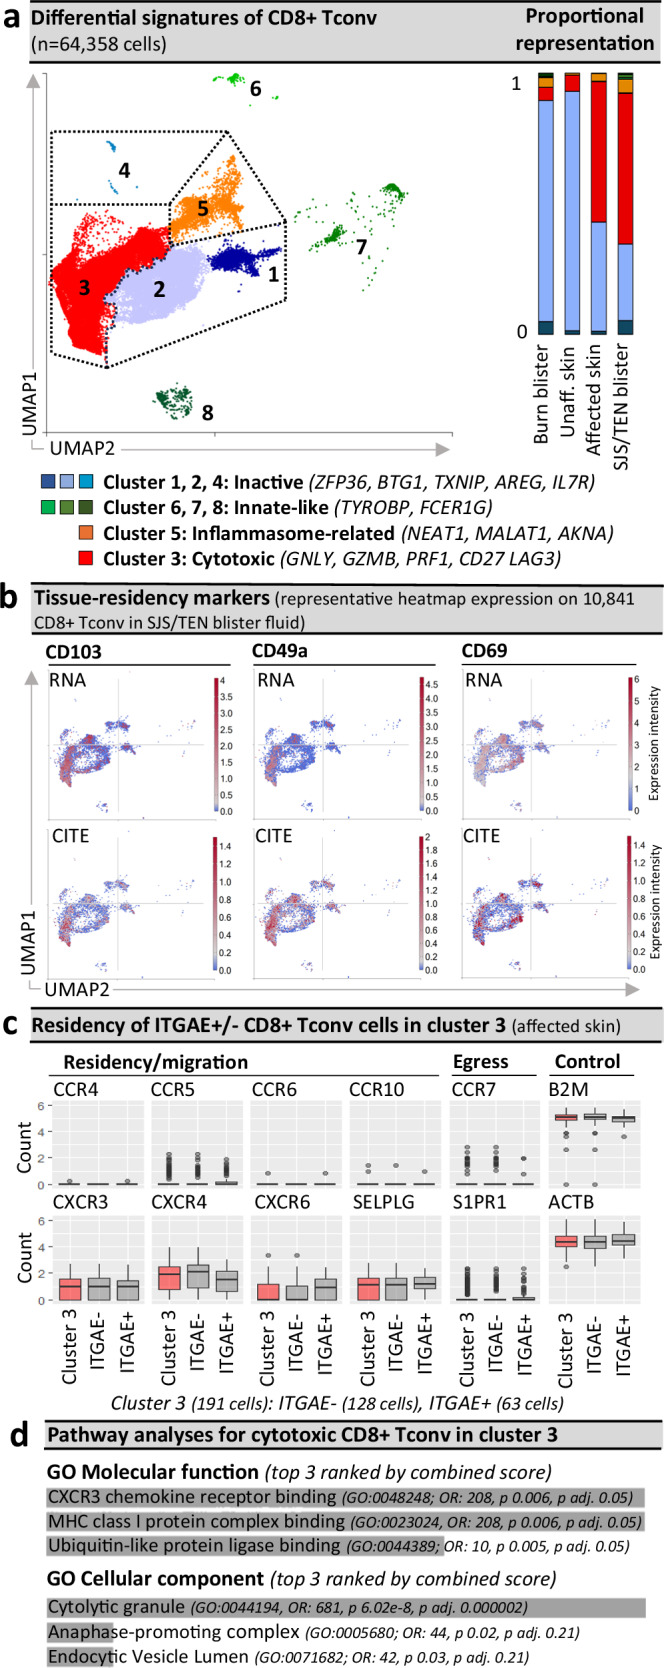
Fig. 2. Pathogenic CD8+ Tconv are ITGAE +/− cytotoxic tissue-resident memory-like populations.

a Seurat-defined CD8+ Tconv clusters 1–8 across cells from normal skin (n = 1 donor), burn blister fluid (n = 4 patients), and unaffected and affected SJS/TEN skin (n = 1 patient) and SJS/TEN blister fluid (n = 15 patients; total n = 64,358 cells: cluster 1, n = 3295 cells; cluster 2, n = 19,761 cells; cluster 3, n = 36,428 cells; cluster 4, 60 cells; cluster 5, 3395 cells; cluster 6, 280 cells; cluster 7, 743 cells; cluster 8, 381 cells) with shared naming according to differential cluster makers. Clusters with < 20 cells were removed from cluster marker analyses (n = 15 cells). A proportional representation of CD8+ Tconv clusters in control and disease sample phenotypes is shown. b Heatmap expression (high to low, red to blue) of RNA and surface protein for ITGAE (CD103), ITGA1 (CD49a), and CLEC2C (CD69) on CD8+ Tconv of SJS/TEN blister fluid. UMAP shows representative 10,841 CD8+ Tconv cells obtained within a single 10x run. c Box plot expression of interest genes aligned with tissue residency, migration, and egress on ITGAE+ and ITGAE- CD8+ Tconv cluster 3 of affected skin (n = 1 patient, 128 ITGAE- cells, 63 ITGAE+ cells). Expression of housekeeping genes B2m and ACTB are shown as a control. For box plots, the bounds of the box represent the interquartile range from the 25th to 75th percentile, the center line shows the median expression, and whiskers identify maximum and minimum values to the 10th and 90th percentile, respectively. Outliers are shown. d Pathway analysis using the significantly enriched cluster markers genes of CD8+ Tconv cluster 3. All cluster marker genes above significance and 0.6 log2 fold change 0.6(log2FC) were included. Analyses were performed using Enrichr90 and Gene Ontology (GO) molecular and cellular terms, which were ranked by combined score. Figure created using Visual Genomics Analysis Studio (VGAS)89. Source data are provided as a Source Data file. Tconv, T conventional cell; GO, Gene Ontology; OR, odds ratio; p adj., adjusted p-value; CITE, cellular indexing of transcriptome and epitopes; SJS/TEN, Stevens-Johnson syndrome and toxic epidermal necrolysis.
