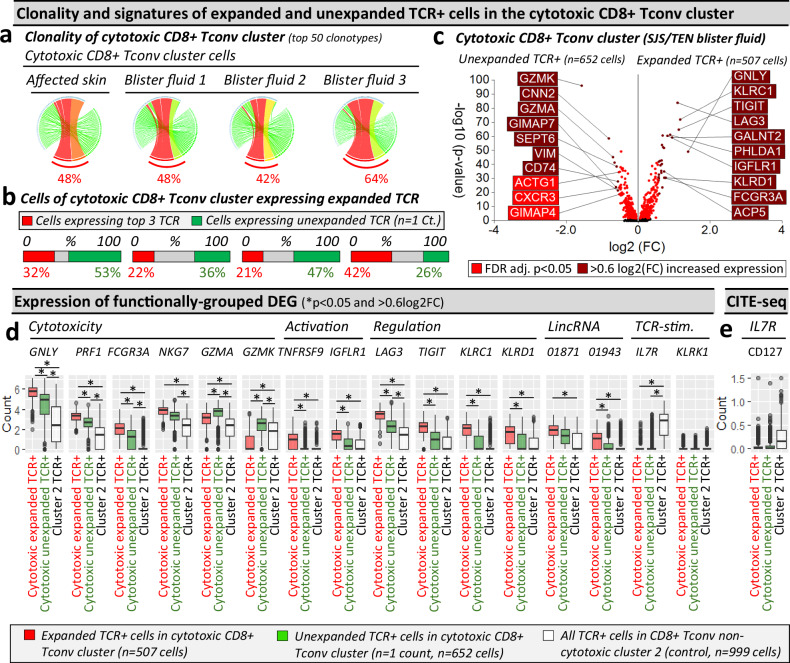
Fig. 4. Cells in the cytotoxic CD8+ Tconv cluster consist of TCR-dependant expanded and unexpanded clonotypes.
a–c Clonality of cells in the cytotoxic CD8+ Tconv cluster in affected skin and blister fluid samples from a single patient with SJS/TEN. a Clonality of cells in the cytotoxic CD8+ Tconv cluster. The top 50 TCRs are shown to demonstrate a similar expanded representation of the top TCRs. The percentage indicates the proportion of counts aligned to the top 3 dominantly-expanded TCRs. Circos plot segment width is proportionate to dominance (increasing green to red). b Proportional expression of dominantly-expanded TCRαβ (TCR+) cells (red) and unexpanded clonotypes (green, n = 1 count) in all cells of the cytotoxic CD8+ Tconv cluster across affected skin (n = 144 cells) and blister fluid samples (blister fluid 1, n = 919 cells; blister fluid 2, n = 379 cells; blister fluid 3, n = 532 cells). c Differential gene expression signatures (two-tailed Wilcoxon, Hochberg adj, p < 0.05) between expanded or unexpanded TCRαβ (TCR+) cells of the cytotoxic CD8+ Tconv cluster in SJS/TEN blister fluid. Genes colored red are significantly (p < 0.05) increased (light red < 0.6log2FC, dark red > 0.6log2FC). The top 10 genes are labeled. d, e Expression of functionally grouped genes and protein. d Expression of DEG and interest TCR-activation-related genes, and (e) surface scCITE-seq surface protein for CD127 between cells of the cytotoxic Tconv cluster expressing expanded TCR (red, n = 507 cells) or unexpanded TCR (green, n = 652 cells) compared to cells expressing TCR from non-cytotoxic Tconv cluster 2 (control; white, n = 999 cells) in a single patient with SJS/TEN. For box plots, bounds of the box represent the interquartile range from the 25th to 75th percentile, the center line shows the median expression, and whiskers identify maximum and minimum values to the 10th and 90th percentile, respectively. Outliers are shown. *Indicates significant differential expression (two-tailed Wilcoxon, Hochberg adj, p < 0.05 and >0.6 log2FC). Figure created using Visual Genomics Analysis Studio (VGAS)89. Source data are provided as a Source Data file. TCR, T cell receptor; Dom TCR, Dominantly-expanded TCR; Tconv, T conventional cell; CDR3, Complementary determining region 3; FDR, false discovery rate; FC, fold change; LincRNA, long intergenic non-coding RNA; Unaff, Unaffected; Aff, Affected; SJS/TEN, Stevens-Johnson syndrome and toxic epidermal necrolysis.

