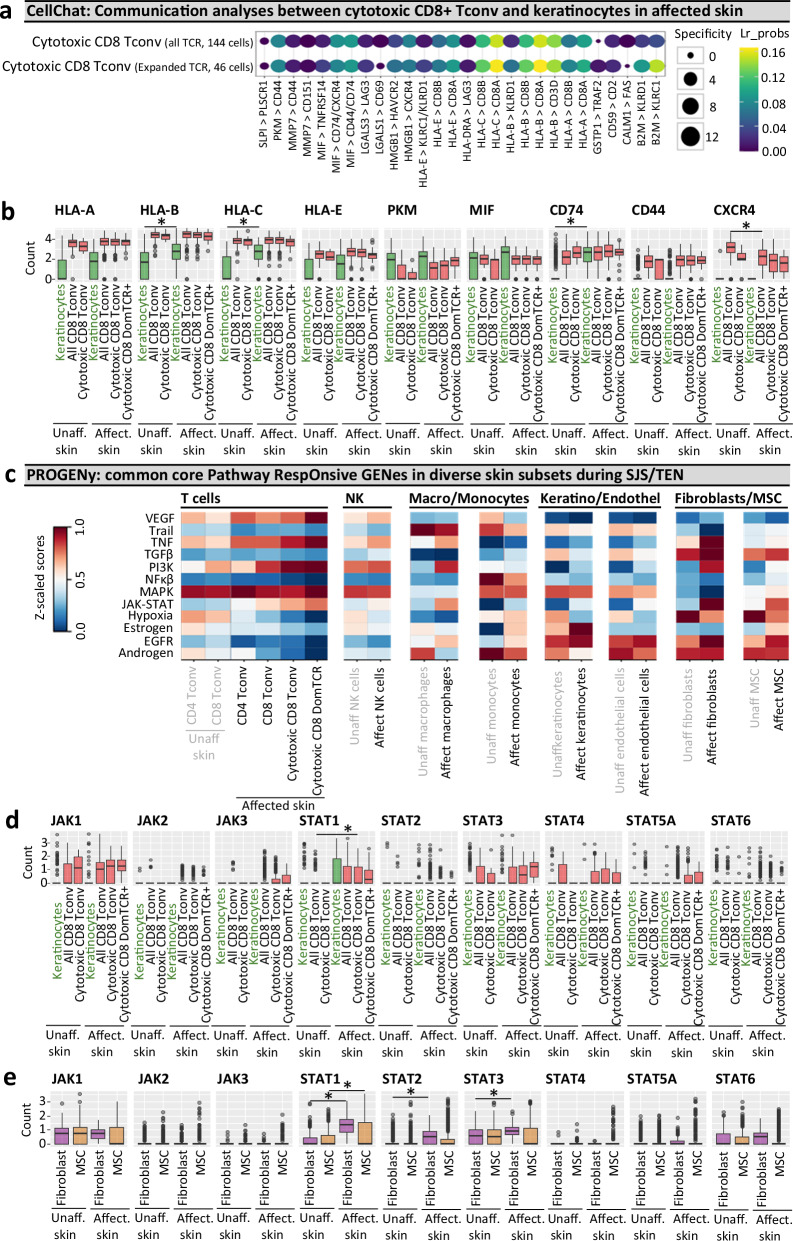
Fig. 5. Cell communication and pathway analysis tools predict receptor-ligand interactions and the role of accessory populations during SJS/TEN.
a, b Cellchat communication analyses. a Highly ranked receptor-ligand interaction between keratinocytes and TCRαβ(TCR+)cells of the cytotoxic CD8+ Tconv cluster, including those expressing dominantly-expanded TCR+ cells. LIANA was used to rank and visualize the highest-scoring receptor-ligand interactions from CellChat. Increasing dot size indicates a more significant p-value for the specificity of an interaction to a given pair of cell groups, with coloring blue to yellow indicating higher bioinformatic ligand-receptor (Lr) probability as a measure of the magnitude of interaction strength. p-values are computed from the one-sided permutation test in CellChat. b Box plot expression of key receptors and ligands implicated by Cellchat on keratinocytes and cells of the cytotoxic CD8+ Tconv cluster in unaffected and affected SJS/TEN skin from a single patient with time-paired samples. Cells are shown for unaffected skin (keratinocytes, 331 cells; CD8+ Tconv, 142 cells; cytotoxic CD8+ Tconv, 9 cells) and affected skin (keratinocytes, 108 cells; CD8+ Tconv, 356 cells; cytotoxic CD8+ Tconv, 191 cells, cytotoxic CD8+ DomTCR, 46 cells). *Indicates significant differential expression (two-tailed Wilcoxon, Hochberg adj, p < 0.05 and > 0.6 log2FC). Significantly increased expression in keratinocytes of affected skin was identified for HLA-B (Pc = 5.19E-05), HLA-C (Pc = 8.66E-12), and CD74 (Pc = 1.18E-34). CXCR4 was significantly downregulated in CD8+ Tconv of affected skin (Pc = 1.29e-11). c–e PROGENy pathway analyses. c Comparative heatmap expression (blue to red, low to high) of key cellular pathways in diverse subsets of unaffected skin (CD8+ Tconv, 142 cells; CD4+ Tconv, 118 cells; endothelial cells, 558 cells; fibroblasts, 594 cells; MSC, 673 cells; keratinocytes, 331 cells; macrophages, 18 cells; NK cells, 67 cells; monocytes, 45 cells) and affected skin (CD8+ Tconv, 356 cells; CD4+ Tconv, 155 cells; endothelial cells, 177 cells; fibroblasts, 219 cells; MSC, 578 cells; keratinocytes, 108 cells; macrophages, 21 cells; NK cells, 136 cells; monocytes, 220 cells) from a single SJS/TEN patient. Expression of JAK and STAT genes in (d) keratinocytes and cells of the cytotoxic CD8+ Tconv cluster, including those expressing dominantly-expanded TCR clonotypes, and (e) fibroblasts and MSC of time-paired unaffected and affected skin from a single SJS/TEN patient. *Indicates significant differential expression (two-tailed Wilcoxon, Hochberg adj, p < 0.05 and > 0.6 log2FC). Significantly increased expression in fibroblasts of affected skin was identified for STAT1 (Pc = 4.63E-68), STAT2 (Pc = 1.85E-27), and STAT3 (Pc = 6.41E-09). STAT1 was significantly upregulated in MSC (Pc = 5.55E-10) of affected skin, and significantly upregulated in cytotoxic CD8+ Tconv of affected skin (pc = 0.00073) compared to CD8+ Tconv of unaffected skin. Figure created using Cellchat51, LIANA91, PROGENy56, and Visual Genomics Analysis Studio (VGAS)89. For all box plots, the bounds of the box represent the interquartile range from the 25th to 75th percentile, the center line shows the median expression, and the whiskers identify maximum and minimum values to the 10th and 90th percentile, respectively. Outliers are shown. Cells are shown for unaffected skin (keratinocytes, 331 cells; all CD8+ Tconv, 142 cells; cytotoxic CD8+ Tconv, 9 cells; fibroblasts, 594 cells; MSC, 673 cells) and affected skin (keratinocytes, 108 cells; all CD8+ Tconv, 356 cells; cytotoxic CD8+ Tconv, 191 cells, cytotoxic CD8+ DomTCR, 46 cells; fibroblasts, 219 cells; MSC, 578 cells). Source data are provided as a Source Data file. Pc, corrected p-value; DomTCR, dominantly-expanded T cell receptors; Tconv, T conventional cell; Lr_probs, ligand-receptor probability; Unaff, Unaffected; Affect, Affected; SJS/TEN, Stevens-Johnson syndrome and toxic epidermal necrolysis, MSC, mesenchymal stromal cell.

